For intraday trading and scalping, how many days before the present
trading day should I go back to look for potential support and resistance lines?
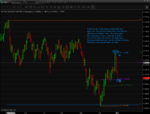
Because one trading day is enough to fill my screen with lines and make my
trading range look like every day is going to turn every 5 cents.
Right now I mark potential support and resistance lines from the day before
and look also in the daily chart of the stock that im trading.
Thanks,
Roi.
trading day should I go back to look for potential support and resistance lines?
Because one trading day is enough to fill my screen with lines and make my
trading range look like every day is going to turn every 5 cents.
Right now I mark potential support and resistance lines from the day before
and look also in the daily chart of the stock that im trading.
Thanks,
Roi.