TheMoneyShot
Newbie
- Messages
- 4
- Likes
- 0
hi,
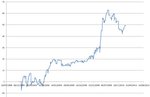
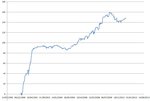
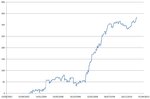
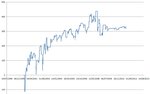
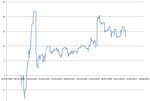
i have assembled a system for stock trading which generated P&L graphs similar to the ones attached (the y axis is arbitary points) for a good range of input parameters; they're choppy but realistic and clearly moving upwards. the graphs are similar for 10/10 of the stocks that i have tested. my question is this: would you consider these good enough to start trading big money? i have never seen a professional trader's P&L graph and so can't compare. (the only ones i have seen are from curve-fitted commercial systems which seem too unrealistic.)
EDIT: i should also mention that out of the 10 stocks that i have tested, no 2 stocks have a correlation coefficient greater than 0.5 (and by correlation i mean the correlation in closing price change as a percentage).
Attachments
Last edited: