China Diapers
Established member
- Messages
- 536
- Likes
- 35
Because I spend hours every evening looking at charts training myself to spot patterns, now whenever I see a graph/chart of any random data in the newspaper or on a website I can't help looking for patterns.
The attached examples we have are:
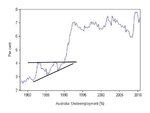
The Australian underemployment breakout of 1990
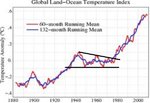
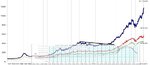
The global land/temperature index breakout of 1980
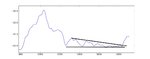
The 500 year basing/accumulation of the Virginia cooling period
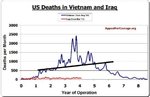
The US Vietnam deaths head and shoulders breakdown
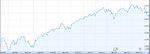
The Las Vegas house prices breakout, which retested resistance/support before really taking off.
What you reckon? I have too much time on my hands? Don't you wish you were long the Global Land-Ocean Temperature Index?
The attached examples we have are:
The Australian underemployment breakout of 1990
The global land/temperature index breakout of 1980
The 500 year basing/accumulation of the Virginia cooling period
The US Vietnam deaths head and shoulders breakdown
The Las Vegas house prices breakout, which retested resistance/support before really taking off.
What you reckon? I have too much time on my hands? Don't you wish you were long the Global Land-Ocean Temperature Index?
Attachments
Last edited: