I wish stuff soaked into my brain faster😡
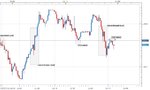
I've been focused solely on trying to figure out support and resistance trading, and trying to understand how to tell if the levels will hold. Every one of y'all who have been trading for a while are going to laugh at this but it's a big epiphany for me.
It's the break of S/R and the first retest.
This hit me on a 4hr chart/ i scrolled down to a 1 min chart and watched it. Just blew me away.
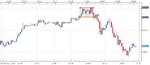