You are using an out of date browser. It may not display this or other websites correctly.
You should upgrade or use an alternative browser.
You should upgrade or use an alternative browser.
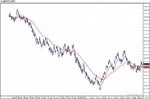
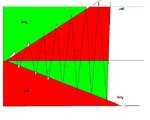
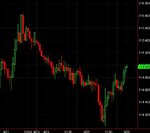
daily chart
every chart elicits feelings of directional bias in a group of 100 traders. If the 90% feel the market will go down and 10% feel it will go up, offers an edge to the most likely direction from here onwards. Afterall can 90% of the people feel they right?, this skew is rewarded at the extremes of a contagion heuristic, times of panic and greed.
every chart elicits feelings of directional bias in a group of 100 traders. If the 90% feel the market will go down and 10% feel it will go up, offers an edge to the most likely direction from here onwards. Afterall can 90% of the people feel they right?, this skew is rewarded at the extremes of a contagion heuristic, times of panic and greed.
Attachments
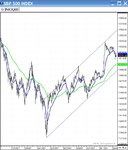
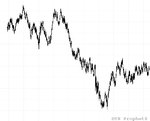
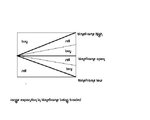
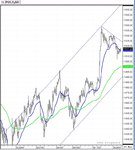
Channels have a high degree of adherence in the market.
compression, taken in the context of the channel, odds are it breaks down to test the channel/trendy. It doesn't have to be today. It could be next week on nonfarm payrolls.
Attachments
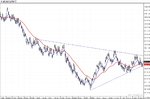
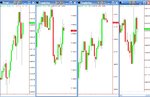
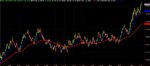
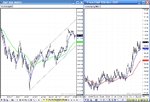
implications of pattern recognition and outcome in unrelated markets. What two markets are these and what timeframes? 🙂
lol, the yellow chart is weekly crude oil, and the white chart is 240 tic YM(Dow).

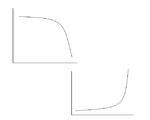
implications of pattern recognition and outcome in unrelated markets. What two markets are these and what timeframes? 🙂
same pattern in yen.
Attachments

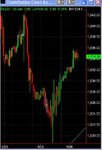
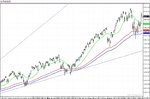
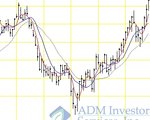
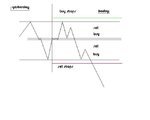
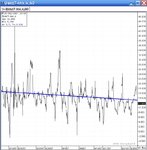
MA's can be used as a measure for testing resistance and support, when price hits resistance, the MA's will cross.
How are the MA's coming along..
Indicates test of upper resistance is still 6 points or so more.
Attachments
implications of pattern recognition and outcome in unrelated markets. What two markets are these and what timeframes? 🙂
pretty much working well, notice this pattern was spotted well in advance of the move. It was recognized manually, since I go through so many charts day to day.
Attachments
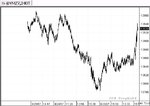
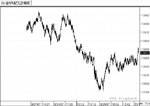
if you look at the channel structure and the 12 point differential, futures at 1537-12 = 1525 on cash, the trendy comes in at 1525 on cash... thats why prices stalled here, I expect to bust through this and test true resistance first at 1542 second at 1552 in futures.
Attachments
Similar threads
- Replies
- 16
- Views
- 6K