How I trade daily commodity futures

agrokid

Newbie
Messages
8
Likes
0
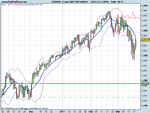
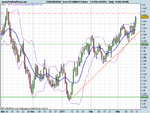
Use realtime charts from ProRealTime. Try to trade five charts, being one chart from each of these five groups: Currencies(AUDUSD, EURUSD, GBPUSD, JPYUSD), Indices(eS&P500,eN100), Grains(Corn, Oats, Soybeans, Wheat), Energies(Natural Gas, Light Crude), Metals(Gold). Draw Bollinger(10,1.9) centred on ma10simple on the close. When the centre line is steeply up make only up bets. When the centre line is steeply down make only down bets. In either case set an SMS alert to trigger when price touches the centre line; that's when you make your bet, up or down as appropriate. Think of this as "buying on weakness" and "selling on strength". When the centre line is horizontal bet down when price is near Bolly Upper then bet up when price is near Bolly Lower. This trick will usually get you into the next steep run at a very good price. Never risk more than 2% of your account and 1% is better. In a long steeply running bet reverse your position if a 1-2-3 formation shows up, or when the centre line becomes horizontal or steep in the other direction. If you're trading the daily chart keep an eye on the weekly chart where you watch the same Bollinger pattern. Be cautious if weekly centre line is up (say) and daily centre line is down. Increase your position when they are both going in same direction. I've done this for nearly twnty years and it works for me. You can trade options on futures in the same way. Use the near month Option. You can trade hourly or fifteen minute charts the same way but you have to sit by a screen all day. Using daily charts look for 50% per year or more. Good luck!
 
well simple system agrokid. you say you have been trading for 20 years? what sort of daily/weekly/monthly/annual return are you achieving over a large sample size?
 
You need to keep track of your account. it is advisable to go in for a notebook system. What this means is to have a notebook designated to tracking your transactions and record charts. It need not be necessary to set up a specific account.
 
In view of the volatile political situation in late March 2011 the instruments I trade have been reduced to just five: eminiS&P500, Comex Gold, AUD/USD, EUR/USD and GBP/USD. These are the steadiest and most predictable. I like to keep the first two because on 9/11 they moved in opposite directions. AUD is really a bet on commodities. Also those three currencies are particularly suitable for trading from top to bottom on Bollinger(10,1.9). Hope this helps someone.
 
Hi agrokid,
I have to say that I'm surprised - and delighted - that such an apparently simple methodology has served you so well for so long. When you have a minute, would you chuck up a chart or two to illustrate the text.
Cheers,
Tim.
 
Timsk, Why not go to your own charting software and draw Bollinger(10,1.9) on any of the instruments I've mentioned ? To learn well you must work hard and long. There's no easy way.
 
Timsk, Why not go to your own charting software and draw Bollinger(10,1.9) on any of the instruments I've mentioned ? To learn well you must work hard and long. There's no easy way.
Really? I didn't realise that!
Of course, I could do as you suggest and, indeed, I would do exactly that if I was interested in this methodology for myself. My request was in the interest of the forum as a whole with my 'Content Manager' hat on - a picture paints a 1,000 words and all that. It's always helpful - IMO - to see how other traders configure their charts, and they add clarity so that someone who is interested in your methodology can confirm that they've interpreted your post correctly. Besides, this place would be terribly dull if it was all text and no graphics!
;)
Tim.
 
Here's another idea I've found useful. Stop drawing charts in landscape format to fill most of your screen. Instead draw then in portrait format to fill about half the width of your screen and include only about three months of daily bars. This gives a better impression of the urgency of the situation. It more clearly distinguishes between "steep" trends (see my original note) and "horizontal" ones. My preference is to use candlesticks but it doesn't really matter.
 
OK, Timsk, here are two charts to help you stay in business. Why has this worked for so long ? The trick is in choosing instruments which move steadily. You'll note I don't trade individual stocks, and you really need a lot of experience to trade agricultural commodities. Another easy one, but quite different, is calendar spreads on crude oil. That too is not for beginners.
 

Attachments

  • E-mini S&P 500 Full0611.png
    E-mini S&P 500 Full0611.png
    20.9 KB · Views: 381
  • Euro FX Full0611 Future.png
    Euro FX Full0611 Future.png
    23.5 KB · Views: 370
Top