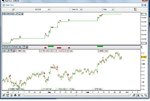
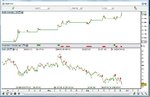
This is your standard trend trader with a few adjustments.
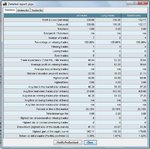
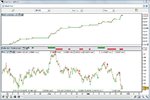
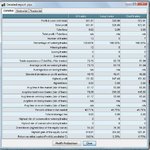
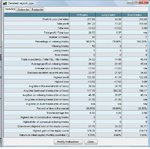
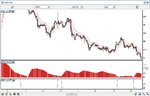
Please see attached images. Code is also available for download. System was coded using ACM ProBacktest. All tests were done with 100 PIP stops.
Comments and or suggestions are invited.
RobertMal.
Please see attached images. Code is also available for download. System was coded using ACM ProBacktest. All tests were done with 100 PIP stops.
Comments and or suggestions are invited.
RobertMal.
Attachments
-
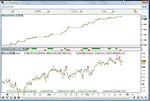 AUDUSD.jpg106.8 KB · Views: 324
 -
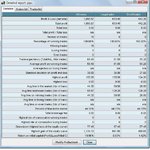 Detailed report for AUDUSD.jpg100.3 KB · Views: 288
 -
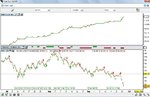 GBPJPY.jpg93.6 KB · Views: 277
 -
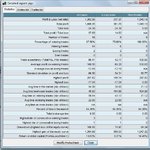 Detailed report for GPBJPY.jpg98.6 KB · Views: 274
 -
 EURUSD.jpg95 KB · Views: 262
 -
 Detailed report for EURUSD.jpg98.7 KB · Views: 246
 -
 GPBUSD.jpg99.3 KB · Views: 322
 -
 Detailed report for GPBUSD.jpg99.2 KB · Views: 262
 -
 USDJPY.jpg91.4 KB · Views: 252
 -
 Detailed report for USDJPY.jpg99.4 KB · Views: 312
 -
 Indicators.jpg91.1 KB · Views: 270
 -
pips.txt995 bytes · Views: 526