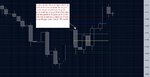
I have been looking at pivot points and found out that on most days on the daily charts the price does touch the pivot point in the center. What popped in my head was if we could enter trades (buy or sell depending on whether the pivot point is above price or below) right at the open of the new daily candle and take profit at the pivot point. Heres an example, check the picture. This is a daily chart. Let me know if there anything similar that works better or a way of using this kind of a strategy better
You are using an out of date browser. It may not display this or other websites correctly.
You should upgrade or use an alternative browser.
You should upgrade or use an alternative browser.
pedro01
Guest
- Messages
- 1,058
- Likes
- 150
If I were to follow such a system, I think I'd want to check the weekly & daily charts first to check the overall trend.
Let's say the overall trend is up - would it increase your chances of having a winning trade if you only ever used this strategy to go long after an open below the pivot ?
Let's say the overall trend is up - would it increase your chances of having a winning trade if you only ever used this strategy to go long after an open below the pivot ?
Am I right in saying your trading to a pivot point as opposed to from a point where the price pivots and turns? I may be wrong. But i'd wait for confirmation of a rejection of support or resistance that has previously been established and lash a stop below or above them points. It's a good system though and has clarity to it if you can develop and refine it. Look for pin bars formed at these points etc. Trader Dante has a stellar thread on them.
Best of luck.
Best of luck.
If I were to follow such a system, I think I'd want to check the weekly & daily charts first to check the overall trend.
Let's say the overall trend is up - would it increase your chances of having a winning trade if you only ever used this strategy to go long after an open below the pivot ?
Definitely. I dont know why i didnt consider that. It sure would reduce chances of losses. Might prevent a few losses as well
Am I right in saying your trading to a pivot point as opposed to from a point where the price pivots and turns? I may be wrong. But i'd wait for confirmation of a rejection of support or resistance that has previously been established and lash a stop below or above them points. It's a good system though and has clarity to it if you can develop and refine it. Look for pin bars formed at these points etc. Trader Dante has a stellar thread on them.
Best of luck.
That is right. I am trading the pivot point itself. (demo trading only right now). As for refining it, that was the reason for this thread. I wanted to see what people said and how they could help improve it. What exactly are pin bars? Is it something like wicks on candles? Is there a link I could visit? I will search google in the meantime
have a good day 😎
Last edited:
Pivot point trading is a good strategy but how many time have you checked it and also what do you use to determine your stop loss.
That is still a grey area right now. Maybe someone visiting the forum can give some suggestions.
okay. I thought you were trading to the actual pivot point. You can stick your stop past the pivot point which will be support or resistance. 15-20 points etc. just once it's sufficient but that's a personal preference. You have to wait for a pivot first to confirm that it was rejected. Also, if support or resistance is broken sufficiently you can treat it as a breakout and stick the stop the other side of the support or resistance and trade it the the other way. You've lots of options and greater probability and clarity round these points so I think you're in the right direction. Search for Trader Dante and you'll fid his thread which deals with pin bars in great length.
Best of luck.
Best of luck.
okay. I thought you were trading to the actual pivot point. You can stick your stop past the pivot point which will be support or resistance. 15-20 points etc. just once it's sufficient but that's a personal preference. You have to wait for a pivot first to confirm that it was rejected. Also, if support or resistance is broken sufficiently you can treat it as a breakout and stick the stop the other side of the support or resistance and trade it the the other way. You've lots of options and greater probability and clarity round these points so I think you're in the right direction. Search for Trader Dante and you'll fid his thread which deals with pin bars in great length.
Best of luck.
Sure. In fact you were right. I am trading to the PP. But I am open to slightly different methods as there are various ways of using the pivot point and the other levels. thanks for the useful info.
👍
pedro01
Guest
- Messages
- 1,058
- Likes
- 150
Perhaps the attached chart will help, it's not EURUSD but the mini Dow.
The dotted lines present the pivot points. The thinner dotted lines are the mid points between the pivots when the pivot points are more than 40 points away from each other. Sometimes, these mid points acts as pivots themselves. Note that pivots only appear in this chart if they are actually near the highs/lows of the last 30 bars.
White - Pivot
Blue - R1 & S1
Green - R2 & S2
Red - R3 & S3 (obviously - you can figure out which are the Rs & Ss)
Anyway - it's a good example because it shows that sometimes the market never gets anywhere near the pivot point.
On the 19th - it opened way above the pivot, so I think you could adjust your strategy to exclude days where the market starts off too far from the pivot point BUT you may decide that on such days you will look at a move in the direction of the overall trend. For instance, on the 19th the market was extremely far from the pivot point, when the market failed to breach R2 around noon and again around 1pm, you may have taken a short (in the direction of the overall trend) with a stop loss at a point or so above R1 and a target at the mid point (which is barely visible on the image).
If you do go for a strategy where you always look for a retracement to the central pivot, you need a stop loss strategy. With a failure to breach a pivot, the pivot itself becomes the stop which is a nice, narrow stop loss. For strategies when you look for a breach of pivot, a retrace and a second breach - you can also use the other side of the pivot as a stop loss.
In your strategy - where would the stop loss be placed ?
Attachments
Perhaps the attached chart will help, it's not EURUSD but the mini Dow.
The dotted lines present the pivot points. The thinner dotted lines are the mid points between the pivots when the pivot points are more than 40 points away from each other. Sometimes, these mid points acts as pivots themselves. Note that pivots only appear in this chart if they are actually near the highs/lows of the last 30 bars.
White - Pivot
Blue - R1 & S1
Green - R2 & S2
Red - R3 & S3 (obviously - you can figure out which are the Rs & Ss)
Anyway - it's a good example because it shows that sometimes the market never gets anywhere near the pivot point.
On the 19th - it opened way above the pivot, so I think you could adjust your strategy to exclude days where the market starts off too far from the pivot point BUT you may decide that on such days you will look at a move in the direction of the overall trend. For instance, on the 19th the market was extremely far from the pivot point, when the market failed to breach R2 around noon and again around 1pm, you may have taken a short (in the direction of the overall trend) with a stop loss at a point or so above R1 and a target at the mid point (which is barely visible on the image).
If you do go for a strategy where you always look for a retracement to the central pivot, you need a stop loss strategy. With a failure to breach a pivot, the pivot itself becomes the stop which is a nice, narrow stop loss. For strategies when you look for a breach of pivot, a retrace and a second breach - you can also use the other side of the pivot as a stop loss.
In your strategy - where would the stop loss be placed ?
wow. thanks a bunch mate.:clap: yes, it would indeed be a good idea to not go for it if it opens too far from the pivot point
Regarding my stop, I am still unclear. Possibly I can put it the same distance away as the profit target is. Still need to see how that works though...Just some news from my side (sorry if im boring you lol): today the strategy would've worked nicely on EUR USD and also GBPUSD i think. The price at 5PM (end of day) was about 1.46120. The pivot was hit...it was at around 1.4658. I didnt enter it though (I wasnt home). But as you said, doesnt work all the time so I do need some fine tuning. Getting quite a bit of knowledge from chatting on forums 🙂
Last edited:
I think Pivots are good when used in conjunction with other strategies. I think bounces off S2 and R2 have more probability of success than retracements from the M levels, PP, S1 & R1. Also, once a pivot has been broken price action does not normally respect that level again.
I use an MT4 indicator from Home Page which automatically calculates and draws the pivots for any loaded chart. Saves a load of agro working them out each day and drawing the respective lines. I also found setting stops too tight to the pivot is almost certainly going to end up in being stopped out.
Anyway - that's my 2 pence worth.
I think Pivots are good when used in conjunction with other strategies. I think bounces off S2 and R2 have more probability of success than retracements from the M levels, PP, S1 & R1. Also, once a pivot has been broken price action does not normally respect that level again.
I use an MT4 indicator from Home Page which automatically calculates and draws the pivots for any loaded chart. Saves a load of agro working them out each day and drawing the respective lines. I also found setting stops too tight to the pivot is almost certainly going to end up in being stopped out.
Anyway - that's my 2 pence worth.
I noticed that too. Stops too close are not great because price often pokes up a few pips before going back (given it does go back). Also, since talking on these forums ive started looking for bounces too than just trading the middle pivot point. I use OANDA (demo, still not live) and it calculates them from 12est-12est. In your experience is it better if it is 5pm-5pm est? Thnks for the input
Hi thedawg, I only just stumbled across this thread, but hopefully you are still trading this strategy, and this may help. I too trade the pivots, and I follow the strategy laid out by John L Person. He has written a couple of books, the one I have is 'Candlestick and Pivot Point Trading Triggers.
Essentially what John does is looks for a candle signal at or around the pivot, S1 or R1, and the ones he is mainly looking for are Dojis and Hammers/Hanging Men. His principle is in a downtrend, watch for the price to open below the pivot, or between pivot and R1, climb, and then display a doji or hanging man at one of those points. On confirmation of a reversal (next candle closes below the low of the signal), go short - target is S1. Obviously in an uptrend, everything is reversed. John also uses weekly and monthly pivots to show areas of major S & R. In addition, he uses MACD and Stochastics or RSI to confirm likely reversal. I have to say it is very effective. There is some more to it, like using MAs based on the pivot values (very enlightening).
If you go here - CBOT - Webinars
there are some recordings available, the first one is a webinar that John did for the Chicago Board of Trade, which explains his strategy in some detail (a lot of the foils are from his book).
How are you currently getting on with using pivots?
Pete.
Hi thedawg, I only just stumbled across this thread, but hopefully you are still trading this strategy, and this may help. I too trade the pivots, and I follow the strategy laid out by John L Person. He has written a couple of books, the one I have is 'Candlestick and Pivot Point Trading Triggers.
Essentially what John does is looks for a candle signal at or around the pivot, S1 or R1, and the ones he is mainly looking for are Dojis and Hammers/Hanging Men. His principle is in a downtrend, watch for the price to open below the pivot, or between pivot and R1, climb, and then display a doji or hanging man at one of those points. On confirmation of a reversal (next candle closes below the low of the signal), go short - target is S1. Obviously in an uptrend, everything is reversed. John also uses weekly and monthly pivots to show areas of major S & R. In addition, he uses MACD and Stochastics or RSI to confirm likely reversal. I have to say it is very effective. There is some more to it, like using MAs based on the pivot values (very enlightening).
If you go here - CBOT - Webinars
there are some recordings available, the first one is a webinar that John did for the Chicago Board of Trade, which explains his strategy in some detail (a lot of the foils are from his book).
How are you currently getting on with using pivots?
Pete.
Hey, thanks for that. I definitely will check the webinar sometime tomorrow. I do use pivot points. I try to see what happens after price reaches the pivot or R1/S1. Something I am still confused on (believe it or not) is what time to calculate pivots. My demo account on OANDA uses 12am-12am EST but I have found a lot of people also use 5pm EST-5PM est. But hopefully the seminar will clear this up for me.
BTW, when you look at candle stick patterns at the pivot levels, what time frame do you use?
Thanks for the help. Good luck with your trading👍😀
Last edited:
Hi again, yes the timing used to calculate pivots is confusing isn't it? I am using IG Index (was using CMC until they messed up their charting), and I have customised an indicator to let me apply daily pivots, and weekly if I want them, and select midpoints and camarillas too if I want. These are all calculated on a 24 hour period, midnight to midnight UK time (because that is what the platform runs on). Now, are they perfect? I don't know, but probably not - for example if I am looking at the FTSE, the calculations will take into account whatever happens during the US and Asian markets, and if they cause a large movement on the FTSE, it will skew the figures. Does this matter? Well that I'm not sure of, but I don't think it does, at least not to a major degree, the FTSE still seems to reflect the pivots. Bear in mind that I use the pivots more as areas to watch for signals, rather than placing a buy or sell order at the specific value, so if they are a few points adrift it doesn't seem to hurt. Maybe a little trial and error is in order - find the high low and close for the various market periods, calculate the pivots manually, then see which set of pivots the instrument seems to respect the most.
As for the time frames I use in my charts, I am going with John Person's recommendation - I watch the daily for the general direction - e.g. if the price is above the Pivot MAs and above the pivot, I will be looking for long signals. Then I will look at 15 and 5 minute charts. The 5 minute is the trigger, and the 15 is the check - e.g. if I am looking for longs, and the 5 minute gives me a doji bottom on the pivot, I will take it if the 15 is signalling long, but ignore it if the 15 is looking like it is about to come down.
Good luck!
Using Pivots and Slow Stochastic
Hi I also use IG's charting to automatically calculate my pivots of a 5 minute intraday chart.
I'm not sure if my method is unconventional or not but it seems to give nice entry/exit signals and can also be applied to Indices as well as forex.
As with a lot of you, the daily trend is important to me so i can get an idea of where the momentum of the trend is.
Then, on a 5 minute chart, I slow the the stochastic oscillator right down to 100,75,15 and/or 50,30,15. There is no real basis to why I chose those figures other than trial and error.
Then, rather than waiting for any breakouts through the S/R lines I wait till I get an overbought/oversold signal from my oscillator when the price is near a support or resistance line (bearing in mind that a support line could be acting as a resistance line depending on where the price and stochastic values are and vice versa).
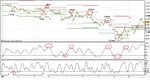
The example below shows the last week or so of trading for the £/$.
Let me know what you think
Hi I also use IG's charting to automatically calculate my pivots of a 5 minute intraday chart.
I'm not sure if my method is unconventional or not but it seems to give nice entry/exit signals and can also be applied to Indices as well as forex.
As with a lot of you, the daily trend is important to me so i can get an idea of where the momentum of the trend is.
Then, on a 5 minute chart, I slow the the stochastic oscillator right down to 100,75,15 and/or 50,30,15. There is no real basis to why I chose those figures other than trial and error.
Then, rather than waiting for any breakouts through the S/R lines I wait till I get an overbought/oversold signal from my oscillator when the price is near a support or resistance line (bearing in mind that a support line could be acting as a resistance line depending on where the price and stochastic values are and vice versa).
The example below shows the last week or so of trading for the £/$.
Let me know what you think
Attachments
Hi lcharm, very similar to what I am doing, although I am waiting for a cross out of overbought/oversold before triggering. The idea of slowing the stochastic down is interesting, I'll have a look at that - in your example, which is which (I assume the two indicators are the two different stochastics)?
Pete.
Pete.
Hi Pete,
Yes they are 2 different stochastics setups. I look at the faster one to aid me in my exits, but when they are both overbought/oversold, i consider that a strong signal.
The normal setup of 14,3,5 or 15,5,5 just looks a complete mess for me on an intraday chart.
Yes they are 2 different stochastics setups. I look at the faster one to aid me in my exits, but when they are both overbought/oversold, i consider that a strong signal.
The normal setup of 14,3,5 or 15,5,5 just looks a complete mess for me on an intraday chart.
Similar threads
- Replies
- 0
- Views
- 6K