You are using an out of date browser. It may not display this or other websites correctly.
You should upgrade or use an alternative browser.
You should upgrade or use an alternative browser.
rathcoole_exile
Guest Author
- Messages
- 3,925
- Likes
- 767
Thought I'd start this week's thread with a look at EUR/USD (CME Futures)
Chart shows a fairly clear H & S chart pattern. Friday's price action was clear break below the 14528 neckline.
i've got a StopSell order in at 1.4402 for continuation of the move south, waiting to get triggered
rathcoole_exile
Guest Author
- Messages
- 3,925
- Likes
- 767
i've got a StopSell order in at 1.4402 for continuation of the move south, waiting to get triggered
triggered, love it when the London session kicks in and kicks some Tokyo ass ! 😆
my cable StopSell at 2.0140 also triggered, still waiting for Stop Buy at 1.0250 againsy the Loonie
shadowninja
Legendary member
- Messages
- 5,524
- Likes
- 645
🙁
Any idea why the sudden big move? EUR/USD just dropped 50 pips, too! 😱
Any idea why the sudden big move? EUR/USD just dropped 50 pips, too! 😱
fibonelli
Experienced member
- Messages
- 1,338
- Likes
- 288
🙁
Any idea why the sudden big move? EUR/USD just dropped 50 pips, too! 😱
the dollar is deflating (on a relative basis) against the other currencies at the moment.
shadowninja
Legendary member
- Messages
- 5,524
- Likes
- 645
But why did it kick in at 4.30pm?
Hang on, surely the dollar is inflating?
Hang on, surely the dollar is inflating?
fibonelli
Experienced member
- Messages
- 1,338
- Likes
- 288
But why did it kick in at 4.30pm?
Hang on, surely the dollar is inflating?
if you have a look at EUR/USD and the DJIA30 stock index you should see a fairly good correlation
shadowninja
Legendary member
- Messages
- 5,524
- Likes
- 645
So... why at 4.30pm?
shadowninja
Legendary member
- Messages
- 5,524
- Likes
- 645
You, too. Doubt there will be any news to trade next week so I won't be active much.
shadowninja
Legendary member
- Messages
- 5,524
- Likes
- 645
Amusingly, 15 minutes after posting, I scalped 20pips on GBP/USD.
bbmac
Veteren member
- Messages
- 3,584
- Likes
- 789
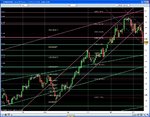
Haven't posted to the ongoing weekly FX threads for a while, so this is a bit retrospective, but interesting nonetheless. (circled in yellow)
The screenshot shows the Dly GBPusd chart and the confluence of potential resistance at that 0580 area, being;
a. First test of the decsending trend line joining highs at 1162 (current yrly hi) and 0832 (red narrow dotted on chart)
b. underside test of the breeched ascending support trend line (green wide dotted on chart)
c. 61.8% fib of that 0832 to 0176 move.
The resulting move down has now taken out the 2 daily ascending trend lines (circled in red on chart) and the weekly ascending channel support (not shown here.)
Attachments
fibonelli
Experienced member
- Messages
- 1,338
- Likes
- 288
Haven't posted to the ongoing weekly FX threads for a while, so this is a bit retrospective, but interesting nonetheless. (circled in yellow)
The screenshot shows the Dly GBPusd chart and the confluence of potential resistance at that 0580 area, being;
a. First test of the decsending trend line joining highs at 1162 (current yrly hi) and 0832 (red narrow dotted on chart)
b. underside test of the breeched ascending support trend line (green wide dotted on chart)
c. 61.8% fib of that 0832 to 0176 move.
The resulting move down has now taken out the 2 daily ascending trend lines (circled in red on chart) and the weekly ascending channel support (not shown here.)
Hi bbmac,
I bet there was momentum divergence in the candle circled in yellow compared to the prior swing high :?: 😉
F
Similar threads
- Replies
- 0
- Views
- 2K
- Replies
- 0
- Views
- 3K
- Replies
- 0
- Views
- 2K
- Replies
- 4
- Views
- 4K