FX Trading Mon 10th - Fri 14th December 07.

bbmac

Veteren member
Messages
3,584
Likes
789
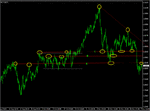
I'll start the Weekly thread off with a look at the 4hr GBPUSD chart ahead of Monday's action....hope this might become a more active thread with multi-pairing contributions.

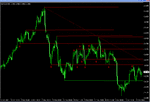
Area A the 0345/55 has acted as both resistance in September and Support in November and is currently acting as resistance again.
Area B is a minor swing hi/low that could now act as resistance in any test from the underside (0450/60) area. As it did the
Area C acted as both resistance then support x 5 and could well act as resistance again any test from the underside…0516-30.

These are main areas to be aware of, and the descending resistance trend line is the nearest potential trend line resistance that is currently as yet untested joining just 2 peaks.

There is also a congestion zone 0242-0496 (white dotted lines) that acted as support on a retest down from the 2.1162 Yrly High, the support finding a lower high at 0832 area and a subsequent breech down to last week's 0174 lows.
 

Attachments

  • 4hr.gif
    4hr.gif
    21.6 KB · Views: 287
Last edited:
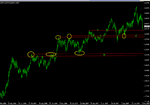
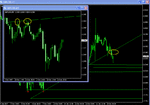
Looking at potential support now further out:

The screenshot is the daily chart, then the weekly chart showing the weekly ascending Trend line/channel that comes through at 2.0100 area.

On the Daily chart:

Area D: 9024-9170, 3 touches as resistance, 1 as support.
Area E: a9840-9908 area, 2 touches as resistance, one as support.
Area F: 0130...a swing hi former resistance area.
 

Attachments

  • 4hr supp.gif
    4hr supp.gif
    17.5 KB · Views: 328
  • wkly.gif
    wkly.gif
    14.3 KB · Views: 245
EUR/USD looks like it'll head up a bit to meet a descending trendline (that's been in action for the last couple of weeks) and then it'll head back down, no doubt in the Asian session. :rolleyes: We'll see.
 
gbpusd

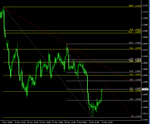
the screenshot shows the fib retraces from the highs at 1162 and 0832 down to last week's lows around 0175 area. Also shown (red dotted) the 2 descending trend lines from the fall, both as yet untested as resistance, joining just 2 points each.

Price just breeching the 38.2% of 0832-0175 as I write this after some minor resistance there.
 

Attachments

  • 4hr.gif
    4hr.gif
    16.6 KB · Views: 272
gbpusd

The steep decsending potential resistance trend line joining highs at 0832 with 0675, could, if tested on this 4hr candle come in around 0485 area, next candle more likely 0471 area.
 
Just made this one on GBP/USD... P/L + 20 pips
 

Attachments

  • TradeFX121007.GIF
    TradeFX121007.GIF
    40.9 KB · Views: 325
the screenshot shows the fib retraces from the highs at 1162 and 0832 down to last week's lows around 0175 area. Also shown (red dotted) the 2 descending trend lines from the fall, both as yet untested as resistance, joining just 2 points each.

Price just breeching the 38.2% of 0832-0175 as I write this after some minor resistance there.
Hi bbmac, on the 4hr cable there is confluence area between 38.2 of the fib (2) and the later 61.8 fib (3). The trend seems to be very much in favour for the market to get there, though poss not today.
Happy trading to all
 
Hi 2be,

Not sure i follow what you mean there ...re (2) and (3) ?
 
Hi 2be,

Not sure i follow what you mean there ...re (2) and (3) ?
sorry bbmac, fib (3) is the latest one on your posted chatrt is white, fib(2) is the yellow one and the confluence area is between the yellow 38.2 @ 2.0553 and white [email protected].
I have numberred them fib 1, 2 and 3 as the first two fibs are brought aotomatically on my chart, with the 3rd one being the latest and 1st the first one being the earliest
 
Thx 2be.

The 1hr screenshot shows the potential near term supports re chart swings and fibs of the move up from the 0175 area lows on any extended pullback.

159pip lo-hi range today at time of writing. Friday was 124, 5,10, 20 day averages being 173, 175 and 195 respectively.

Last week's range 497pips, 400,336 and 348 the 5,10 and 20 week averages respectively.
 

Attachments

  • 1hr.gif
    1hr.gif
    13.7 KB · Views: 256
gbpusd

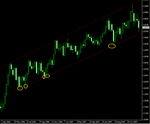
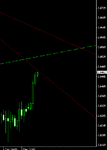
The screenshot shows the 2 descending potential resistance trend lines in cable, (red dotted) as yet untested joining 2 peaks each. The green dotted ascending trend line is the breeched support trend line on the daily chart joining lows of 17/8 18/9 and 16/11.
 

Attachments

  • 1.gif
    1.gif
    5.6 KB · Views: 268
The screenshot shows the 2 descending potential resistance trend lines in cable, (red dotted) as yet untested joining 2 peaks each. The green dotted ascending trend line is the breeched support trend line on the daily chart joining lows of 17/8 18/9 and 16/11.


nice chart I wouldnt mind a bounce off green and red intersect tomorrow in the 545 region
 
gbpusd

Area C acted as both resistance then support x 5 and could well act as resistance again any test from the underside…0516-30.

Finding resistance in this area (0520) after a laboured upside break past yesterdays 0484area high.
 

Attachments

  • chart res.gif
    chart res.gif
    21.6 KB · Views: 262
gbpusd

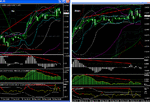
Re above resistance. The 30min (trend time frame) and 1hr both confirmed the reversal set-up on the trigger (1min)


(30min Reversal A [ii] 1hr Reversal C.) Double Regular sequential bearish divergence in the osma on 1hr
 

Attachments

  • 1.gif
    1.gif
    38.8 KB · Views: 250
Last edited:
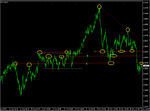
Looking at the main potential chart resistance further out, and above this 0516-30 zone.

Area 1 ...has had 2 hits as resistance 0698/700 area [78.6% fib of 0830-0175 area resides here)
Area 2 ...has had 1 hit as support, 2 as resistance 0755 area...(area could extend to 0778, a higher swing low on way up to 1162 current yearly highs.)
Area 3 ...that 0826-0844 2 lower swing highs , the 0844 after support found in this 0516-30 zone.
Area X ...a former higher swing hi at 0894-00 area on way up to 1162 current yrly hi.
Area 4 ...the last higher swing low at 0974 area in way up to 1162 current yrly hi.
Area 5 ...Current Yearly hi at 1162 area.

The greed wide dotted line is the breeched Daily support trend line mentioned abobve and the red dotted line the potential resistance trend line that joins 1162 with 0830 area, as yet untested.
 

Attachments

  • 2.gif
    2.gif
    20.4 KB · Views: 227
Last edited:
Tip of the day: when trading the news, make sure you know the time the news is coming out.

I thought it was 9.15am so opened a position at 9.10am in expectance of a downward move on GBP/USD. It pulled back making me think I was wrong so I closed position... well, at least it was a moral win! :rolleyes:

Looks like it could have helped me make my target daily pips of 30, too. :rolleyes: x 2

ETA: On EUR/USD, managed to grab a few pips (21) on back of 1.30pm news. \o/ Not sure if I could have done the same on GBP/USD as it moved damned rapidly. Would have been a nice 150+ pips, but I'm happy with my gain.
 
Last edited:
gbpusd Thursday's current situation

Cable finding resistance after the move up yesterday at that 61.8% fib of ther 0832-0175 move, and arguably at the descending resistance trend line joining 1162 (current yearly hi) with 0832.

The charts below show the potential chart resistance (red horizonal lines) and support (green horizontal lines) in the form of the most significant previous swing hi and low areas.

Fibs to the upside now include: 0669-0774 area 2 x fibs being 76.4% of 0832-0175, and 50% of total 1162-0175 fall, 61.8% of that later move coming in at 0785.

50% of this upmove 0175-0581 is around 0379.

The green ascending line on first chart is the potential hourly upward sloping trend line now tested once, (after joining the first 2 lows)

U.s Retail Sales due later.
 

Attachments

  • 1hr.gif
    1hr.gif
    15.6 KB · Views: 160
  • 4.gif
    4.gif
    18.2 KB · Views: 154
Last edited:
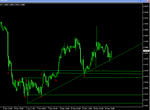
That 1hr ascending support trend line broken to the downside then acted as resistance from an underside test....see screenshot. 143pips hi-lo pip range at end of london/European session, so far today.
 

Attachments

  • eg.gif
    eg.gif
    24.1 KB · Views: 174
long gbp/usd 20247 target 20347 stop loss 20147 reason, looks over sold previous low last week was around this area i expect a bounce.
 
been away for most of this week.
managed uptill now NOT to even READ a single T2W post!
(been road-testing my Alert/SMS, to reduce screen-watching)

hope you guys had a good week. this morning session was a beaut with clean down-moves, esp EURUSD and GBPUSD.
USDJPY good up-move, but more slothlike.
nice EURJPY move down, followed by up-swing to underside of what became resistance around 164.10, for a second short if you missed the first move.
taking the afternoon off.

have a good weekend y'all.

Mr Black: nice new avatar. hope it doesnt translate as "supermarket". :)
 
Top