Murmurings - Basic Chart Analysis

Tinnaz369

Member
Messages
52
Likes
4
Hey guys, I have been looking into trading Forex for a while. I have posted a few times generally looking for direction in trading, I think I have found that with Day Trading Forex. Anyway, enough of that.

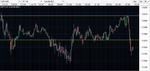
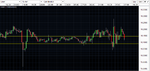
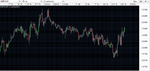
Here I will simply post some of todays charts, with some of my thoughts. Remember I am a complete novice and am just looking to air some of my ideas.

Advice and opinions are ALWAYS appreciated. Go easy :smart:
 
I have attached todays chart for GBP/USD, 22/06/15. I am looking at 15 mins.
Although I firmly believe in trading using a combination of fundamental, technical and price action, these posts will focus mainly on the technical side.

On it I can see an older line of resistance at 1.5908, this does not feature so much in this chart, but if I was looking for an uptrend then this would probably be a good area to get out again as the price could well bounce of this resistance once again.

The second lower line is a more recent line of support which has just been broken, at 1.5871. This is very interesting, will it now become a line of resistance? I think so. And if I was to make a trade this would be something I would look at.

1.5855 has an interesting candle which could signal the end of the downtrend and could become a line of support in the future.
 

Attachments

  • Untitled.png
    Untitled.png
    38.1 KB · Views: 204
Continuing to look at the rest of the charts, I can see that since 09:00am, the USD has had a lot of support and we are seeing similar red candles against every other currency.
 
Here is todays Silver chart, 22/06/15, again 15mins.

This seems to have been ranging overnight (GMT), with one breakout at yesterday, which was quickly corrected.

We have a line of resistance at 16.1451, but as we speak it has just been broken. What will happen now? Will it be quickly forced back down like yesterday or will it turn that resistance into support? Could the support for the USD this morning have something to do with this small breakout? If that is the case it has taken 45mins to react, once again interesting!

The old line of support doesn't seem to relevant right now, after the breakout, at 16.0896.
 

Attachments

  • Untitled.png
    Untitled.png
    19.4 KB · Views: 188
This is GBP/AUD, the final chart I will post today 22/06/15, 15 min chart.

Here we can see there is an old trendline which was working as a line of support, the price bouncing up off it a few times before breaking it at 18:00, yesterday. Now we could be looking for a downtrend which could be beginning right now.

We have an old line of resistance at 2.0447 which held for a while yesterday and appears to have been holding for a while this morning. However as we speak the price is falling below that line of resistance. I would look for a signal that we are at the bottom of the current downtrend and look to enter a trade aiming for close to this line of resistance.
 

Attachments

  • Untitled.png
    Untitled.png
    21.9 KB · Views: 181
This is my first real time looking at the charts, I'm sure my analysis can be interpreted in many different ways. Right now I am just looking for areas, trends, supports and resistances which draw my interest. I will check back later today to see exactly what happened and if I could have taken my feelings from this morning and made some trades, that will come in the future.

Any comments and opinions are always appreciated. I'll check back in later :)
 
GBP/USD - that line of support what was broken did immediately become a line of resistance as the GBP tried to rally, it hit the line and bounced straight back down. A short on the the line would have given us the opportunity for some pips!

Silver - This one broke through the resistance and after briefly using it as support, continued to range. I'm not sure where I would have entered here. Any profits would have been more down to luck on my side.

GBP/AUD - After trending down I stated I would be looking for a signal for a reversal and then looked to support the reversal up to the old line of resistance. This trade would also have made me some pips, depending on whether I spotted the reversal soon enough. As I write this the candles are once again approaching this line of resistance, will they break through or will it bounce off once again?
 

Attachments

  • Untitled.png
    Untitled.png
    36.9 KB · Views: 175
  • Untitled1.png
    Untitled1.png
    23 KB · Views: 169
  • Untitled2.png
    Untitled2.png
    26.4 KB · Views: 202
Top