Johnnyalpha8
Junior member
- Messages
- 26
- Likes
- 0
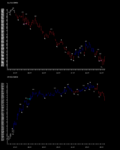
I've just back tested a couple of simple patterns '3 falling peaks' and '3 rising valleys'. The names are kind of self explanatory. Thomas Bulkowski tested them on 500 stocks, each over a period of 5 years, and found them both to be profitable. Here are the results of my back-test of these pattern with futures:
Market: E-Mini S&P 500
----------------------
Set up: Short on b/o of 2nd new low in trend on Thursdays and Fridays, 1st/3rd week of month.
Long on b/o of 2nd new high in trend, if it has a tail on Thursdays in 1st/2nd/3rd week of month.
Longs require a rising 600sma (current close must be higher than close last week this time (approximately)).
Shorts require a falling 600sma (current close must be lower than close last week this time (approximately)).
Profit: Exit on first open that has a profit of greater than one point.
Stop Loss: At most recent Active Low/Most recent Active High.
If profit target is not met by 4pm ET, exit on the close of the 4pm bar.
Details:Commission/Exchange fees:$12.50
Slippage:$25
Number of contracts traded:1
Time-frame:3 minutes
Test period: 2007~2010
Results:Number of Trades: 147
Percentage % of winning trades:78.65%
Maximum Draw down: $1137.5
Minimum account size required (including day trading margin): $1637.50
Total Profit::$1787.50
End balance:$3425
Percentage gain:209.1%
Market: E-Mini Dow ($5)
-----------------------
Setup: Go long (buy stop) on a rising 600sma and a breakout of the NH after the 3rd AL on Thursdays in the 3rd week of the month.
The 3rd active low must have a tail (it cannot be part of a double 3 min low).
Profit target:Exit at market if the current open if greater than 30 points above your entry.
Stop Loss:At the prior AL.
Go short (sell stop) on a falling 600sma and a breakout of the NL after the 3rd AH on Mondays.
Profit target:Exit at market if the current open is less than 40 points below your entry.
Stop loss:At the prior AH.
If profit target is not met by 4pm ET, exit on the close of the 4pm bar
Details: Number of contracts traded:1
Test period: 2007~2010
Commission/Exchange fees:$10
Slippage:$10
Time-frame:3 minutes
Results: Number of Trades: 37
Win rate (% of successful trades): 65.01%
Total Profit:$2105
Maximum Draw down: -$1950
Starting balance (minimum account size required) $2450
End balance:$4555
Percentage gain:185.91%
If you are interested you can watch a video of the system on youtube:
3 Year back-tested trading system, peforms modestly well! - YouTube
If you like it, leave a comment on YT, I'd be v. happy!