TASK
Member
- Messages
- 50
- Likes
- 2
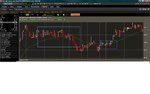
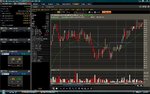
Hey guys, I have a question, what indicator should I use to supplement my moving averages when they are range trading. As you can see from the blue highlighted boxes in my screen shot, moving averages aren't very useful when price action is range trading. the red and green arrows are giving me a ton of buy/sell signals. I'm guessing I could use adx to tell me that the trend is weakening and moving into ranging price action and just avoid trading until trend strength increases. Thanks for the help guys!