There are a lots of words thrown around in trading terminology but no one really understand truly what they mean when it comes down to trading and reading the text to truly understand what the author wants to say. This word "setup" in particular is an all-encompassing word. So some clarification is needed.
The setup means different things to different authors. In general, a setup is an area (price or indicator) where he would take action; this can be opening a position or closing one. The setup has to meet a number of criteria either from price, volume or any number of indicators being used. Setups can come at different times of the day or weeks. For a scalper, one setup may appear one after another, providing him many opportunities throughout the day to trade and possibly profit. There are setups for day trader where it may come up a few time to less than a dozen times a day to trade. As for the swing trader, this may come a few times a week. It all depends on the strategy and indicators he uses.
Let's take an example, a setup for a stochastics indicator may be whenever the reading goes above 80%, a setup to sell is given. On the opposite end, whenever a reading goes below 20%, it's oversold, it may be a setup to go long as seen below in Figure 1.
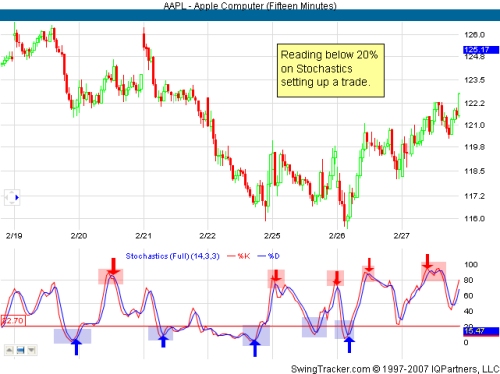
caption: Figure 1
Another type of setup maybe using Stochastics is the use overbought and oversold reading along with the use of the red and blue line crossovers. For example, when the both the red and blue lines go below 20%, there is no setup. Only when the red line goes above the blue line is it a setup to take the long trade (vice versa for short trade setups).
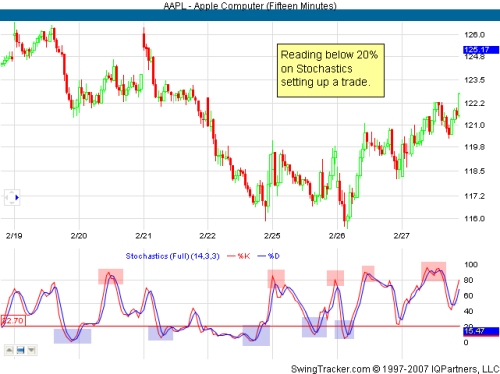
caption: Figure 2
As one can see from figure 2, there are 5 long and 5 short setups. This doesn't seem so bad if they are swing trades (for others it's too many for a 10-day period). But imagine if this is an intraday trading, the setups are intensely compact and could be considered overtrading.

caption: Figure 3
In the chart, above, this is a price action or price pattern setup. One setup (in pink) is a bottom, creating a long setup, while a top is formed, creating a short setup.
It's possible to assign one setup to a single pattern or a single movement of the market, either a downtrend or an uptrend. Basically a trader can decide that a market top for him is a setup and there will be no other setup until another market top appears. For pattern traders, a triangle breakout is a setup and there will no other setups until another triangle (or another pattern) and prices break out of it. Figure 4 shows a pattern setup.
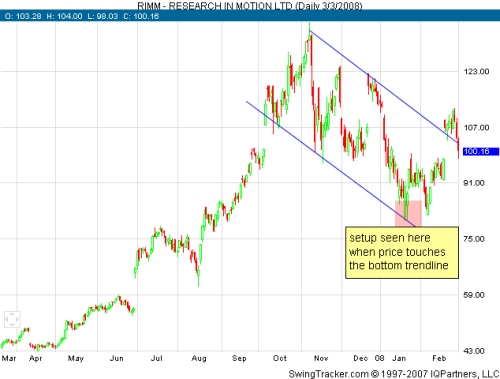
caption: Figure 4
By identifying one setup from the next, the trader can evaluate how many trades there are in a setup or how many setups there are in a day. This would provide an idea how many trades he should be making per day in order to avoiding overtrading. In addition, if he can identify the maximum number of trade he's going to take, this should eliminate taking too many trades from just one setup. By spreading out his trades, he has more opportunities to profit from a setup that will possibly bring him back into black.
The setup means different things to different authors. In general, a setup is an area (price or indicator) where he would take action; this can be opening a position or closing one. The setup has to meet a number of criteria either from price, volume or any number of indicators being used. Setups can come at different times of the day or weeks. For a scalper, one setup may appear one after another, providing him many opportunities throughout the day to trade and possibly profit. There are setups for day trader where it may come up a few time to less than a dozen times a day to trade. As for the swing trader, this may come a few times a week. It all depends on the strategy and indicators he uses.
Let's take an example, a setup for a stochastics indicator may be whenever the reading goes above 80%, a setup to sell is given. On the opposite end, whenever a reading goes below 20%, it's oversold, it may be a setup to go long as seen below in Figure 1.
caption: Figure 1
Another type of setup maybe using Stochastics is the use overbought and oversold reading along with the use of the red and blue line crossovers. For example, when the both the red and blue lines go below 20%, there is no setup. Only when the red line goes above the blue line is it a setup to take the long trade (vice versa for short trade setups).
caption: Figure 2
As one can see from figure 2, there are 5 long and 5 short setups. This doesn't seem so bad if they are swing trades (for others it's too many for a 10-day period). But imagine if this is an intraday trading, the setups are intensely compact and could be considered overtrading.
caption: Figure 3
In the chart, above, this is a price action or price pattern setup. One setup (in pink) is a bottom, creating a long setup, while a top is formed, creating a short setup.
It's possible to assign one setup to a single pattern or a single movement of the market, either a downtrend or an uptrend. Basically a trader can decide that a market top for him is a setup and there will be no other setup until another market top appears. For pattern traders, a triangle breakout is a setup and there will no other setups until another triangle (or another pattern) and prices break out of it. Figure 4 shows a pattern setup.
caption: Figure 4
By identifying one setup from the next, the trader can evaluate how many trades there are in a setup or how many setups there are in a day. This would provide an idea how many trades he should be making per day in order to avoiding overtrading. In addition, if he can identify the maximum number of trade he's going to take, this should eliminate taking too many trades from just one setup. By spreading out his trades, he has more opportunities to profit from a setup that will possibly bring him back into black.
Last edited by a moderator: