If you have been following the NASDAQ index, you know that prices have been making all-time market highs lately, even though the other indexes have been stuck in a range. There are a lot of stocks that are also at an all-time market high. As traders, we know that we should participate in the dominant trend but base our exits on supply and demand zones. The biggest question when a market high has been hit becomes: where are we supposed to exit when we do not have a supply zone to mark the top?
There are a couple of technical tools that we can use to identify probable targets for our trades, both intraday and on swing trades. It is important to note that none of these are as strong as actual supply zones but they do seem to offer higher probability targets when we are breaking out into the unknown territory of market highs.
Measure Momentum
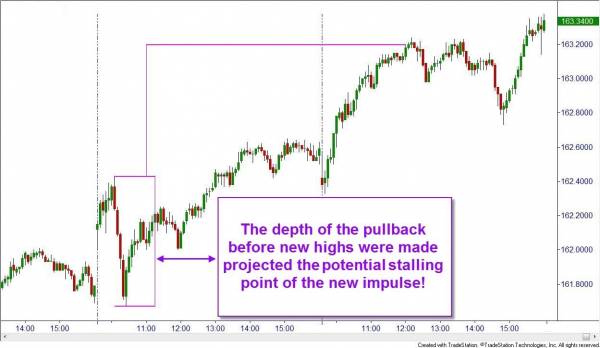
The first method for determining where to exit a trade when a market high has been hit is one of the easiest. Before prices break to new highs, they often pull back to gain momentum. If you measure the depth of the pullback and then project that same length at the breakout, it will often mark the area of the first correction after the breakout.

Fig1
When we've hit all-time market highs you can use momentum to determine where to exit your trade.
I have previously used this method in my Futures class to identify targets that were extremely accurate in all types of futures contracts and in many different time frames. Think of price as a pendulum, it swings backwards just as much as it will swing forwards with similar momentum.
Fibonacci Extension Tool
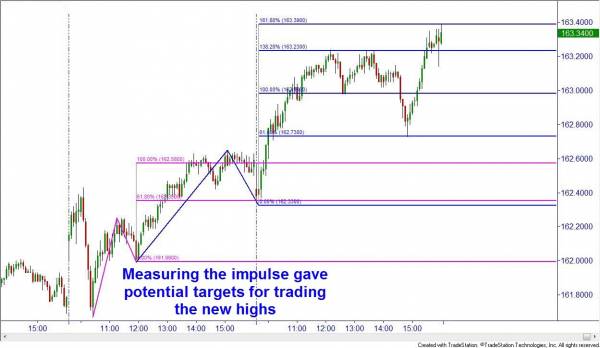
The next method offers multiple targets and uses a tool that is available on most software platforms. The Fibonacci Extension tool measures the impulse prior to the breakout and then projects certain measurements of that impulse from the recent lows. An impulse is a strong move in the direction of the dominant trend. After the impulse has corrected, you can project where the new impulse will likely stall.
The fibonacci extension tool can be used to determine where to exit a trade when the market has hit all time highs

Fig2
Moving Average
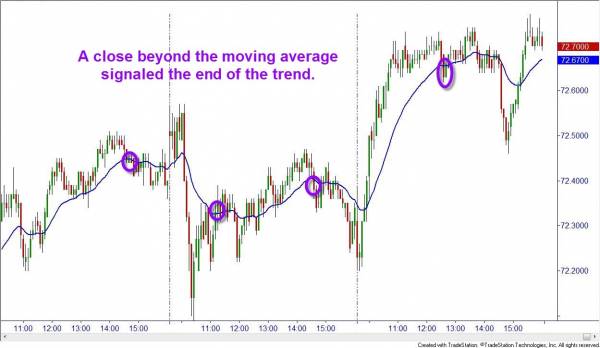
The last method for how to trade during an all-time market high is to simply wait for a signal that the trend has been broken. Moving averages offer a summary of the current trend and the mean price. In a bullish trend, prices should move away from an average and then snap back to it but not close below the moving average. This is called reversion to the mean. If price breaks the moving average by closing below it, then the trend has likely ended.

Fig3
Moving average is a trading tool that can be used to determine where to exit trades when the market is at all-time highs.
There are two problems with this technique. First, you will never exit at the top of the move since we wait for a pullback to trigger the exit. That is fine though as we can still participate and profit from the majority of the move.
The second problem is the choice of the period for the moving average. We need to select a period or length of the moving average that price will respect for the trend. Stocks and timeframes differ and one moving average may not work for all securities although there are some advanced techniques for finding the best length.
So if the price of your security breaks to new highs, these methods might help you be better prepared to take your profits at the right time rather than trying to guess. Don’t forget, the best entries and exits for trades are always found at strong supply or demand zones.
Brandon Wendell can be contacted on this link: Brandon Wendell
There are a couple of technical tools that we can use to identify probable targets for our trades, both intraday and on swing trades. It is important to note that none of these are as strong as actual supply zones but they do seem to offer higher probability targets when we are breaking out into the unknown territory of market highs.
Measure Momentum
The first method for determining where to exit a trade when a market high has been hit is one of the easiest. Before prices break to new highs, they often pull back to gain momentum. If you measure the depth of the pullback and then project that same length at the breakout, it will often mark the area of the first correction after the breakout.

Fig1
When we've hit all-time market highs you can use momentum to determine where to exit your trade.
I have previously used this method in my Futures class to identify targets that were extremely accurate in all types of futures contracts and in many different time frames. Think of price as a pendulum, it swings backwards just as much as it will swing forwards with similar momentum.
Fibonacci Extension Tool
The next method offers multiple targets and uses a tool that is available on most software platforms. The Fibonacci Extension tool measures the impulse prior to the breakout and then projects certain measurements of that impulse from the recent lows. An impulse is a strong move in the direction of the dominant trend. After the impulse has corrected, you can project where the new impulse will likely stall.
The fibonacci extension tool can be used to determine where to exit a trade when the market has hit all time highs

Fig2
Moving Average
The last method for how to trade during an all-time market high is to simply wait for a signal that the trend has been broken. Moving averages offer a summary of the current trend and the mean price. In a bullish trend, prices should move away from an average and then snap back to it but not close below the moving average. This is called reversion to the mean. If price breaks the moving average by closing below it, then the trend has likely ended.

Fig3
Moving average is a trading tool that can be used to determine where to exit trades when the market is at all-time highs.
There are two problems with this technique. First, you will never exit at the top of the move since we wait for a pullback to trigger the exit. That is fine though as we can still participate and profit from the majority of the move.
The second problem is the choice of the period for the moving average. We need to select a period or length of the moving average that price will respect for the trend. Stocks and timeframes differ and one moving average may not work for all securities although there are some advanced techniques for finding the best length.
So if the price of your security breaks to new highs, these methods might help you be better prepared to take your profits at the right time rather than trying to guess. Don’t forget, the best entries and exits for trades are always found at strong supply or demand zones.
Brandon Wendell can be contacted on this link: Brandon Wendell
Last edited by a moderator:
