When the equities market is in distress, is taking a long position in gold a profitable strategy?
The conventional thinking among pundits supports taking a long position in this precious metal as a way of mitigating strong losses in the equities market. Fortunately, many active market participants prefer to run the numbers before acting on this long held assumption about market direction. This study attempts to prove or disprove this form of hedging strategy by performing an analysis on two active funds: the spiders (SPY), which are the best representation of the equities market (averaging 205 million shares per day), and the SPDR Gold Shares fund (GLD) with 15.7 million shares a day serves as our dependent variable.
In this study, our operational definition of a setback – within the previous 300 trading days (Apr 11, 2011 to Jun 19, 2012) – is a daily loss in excess of $1.00 in the spiders.
The findings show 65 days with a $1.00-plus loss in the spiders. On these days, were investors holding a long position in this precious metal fund profitable? Not really; the summary loss was -$22.98 (a 35¢ daily setback on a 100 share long position) with 32 wins against 33 losses. Apparently, gold bugs hedging against a strong downdraft in equities found this to be a poor insurance bet.
When making an assessment of excessive scores, a scatter gram displays more information regarding the past daily combinations of these two instruments. Below is a comparison of the spiders (X axis) with those 65 days with a loss in excess of $1.00, the performance of this gold fund (Y axis) is given in response to the daily loss in the spiders.
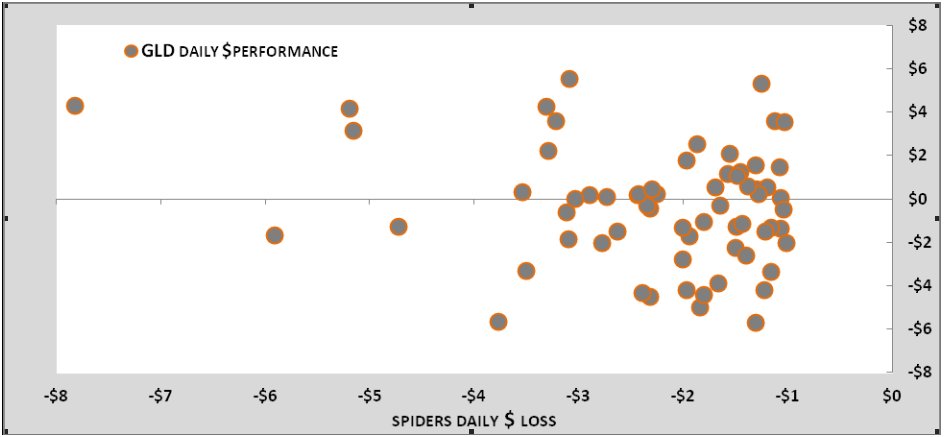
Fig1
Given this scatter chart, we can track how this gold fund reacts when the spiders drop 60 cents. For instance, in the upper left corner the spiders fell $7.82, whereas, the yellow metal had one of its best performances (Aug 8, 2011), finishing the day with a $4.28 advance. Apparently, it takes an excessive loss; more specifically, a loss of $3.20 or more, before this system experiences a profit.
On the 11 days with a <-$3.20 loss in the spiders, if you invested in this fund holding gold bullion in a vault in London, there were 7 advances against 4 declines, with $10.01 in profits. So, if we were to buy gold on these days we would make a nice daily profit, but there is one slight problem with this thinking, that is, we can’t trade the past. Consequently, we have to assess the performance of the spiders from an earlier timeframe in order for us to make decisions about the future direction of this yellow metal.
research question: If the spiders (SPY) drop 60-plus cents when trading from 6:00 to 9:00 in the morning, should we take a long position in GLD? More specifically, we would take a long position at 9:00, hold it, and offset it at 15:00 hours.
DATES OF STUDY: Jan 31, 2011 to Jun 19, 2012 (350 trading days).
GLD price:
Jan 31, 2011 its 9:00 price = $129.43.
Jun 19, 2012 its 15:00 price = $157.27
In these 350 trading days the frequency of a <- 60¢ drop in the spiders between the hours of 6:00 to 9:00 was not uncommon, there were 34 records found (9.71%). Since this condition occurs roughly once in every 10 trading days, an analysis of this condition is a meaningful endeavor.
In any case, the question remains, how did this gold fund perform under these conditions? In these 34 days, taking a long position from 9:00 to 15:00 provides the investor with $1.13 in profits; however, without a more introspective examination of your findings, you are doing yourself a disservice. Before rendering a final decision, always seek to ask more questions of your findings. For instance, answers to the following questions offer us more of an understanding regarding the parameters of this trading condition:
1) How does this $1.13 profit compare to the performance of this GLD fund when trading in this six-hour setting when the spiders do not have a 60-plus cent decline?
When not adopting this system, this fund had a cumulative loss of $9.42 in 316 days; however, it was capable of producing more winning trades with a record of 161 – 154 – 1. Seen from this perspective, the slight $1.13 advance in 34 trades begins to look more appealing.
2) When using this strategy, the results disregard the early morning direction of this GLD fund. If we refrain from taking a long position when this instrument either advances or declines from 6:00 to 9:00, does it enhance our performance results?
In this condition, we have two different categories both playing off the strong early morning loss in the spiders:
- An early morning loss (6:00 to 9:00) in excess of 60 cents in the spiders along with an advance in GLD.
- An early morning loss (6:00 to 9:00) in excess of 60 cents in the spiders along with a decline in GLD.
An examination of both of these conditions shows a performance discrepancy. When taking a long position from 9:00 until 15:00, an excessive early morning loss in the spiders AND an advancing three-hour session in this fund, was the more profitable category.
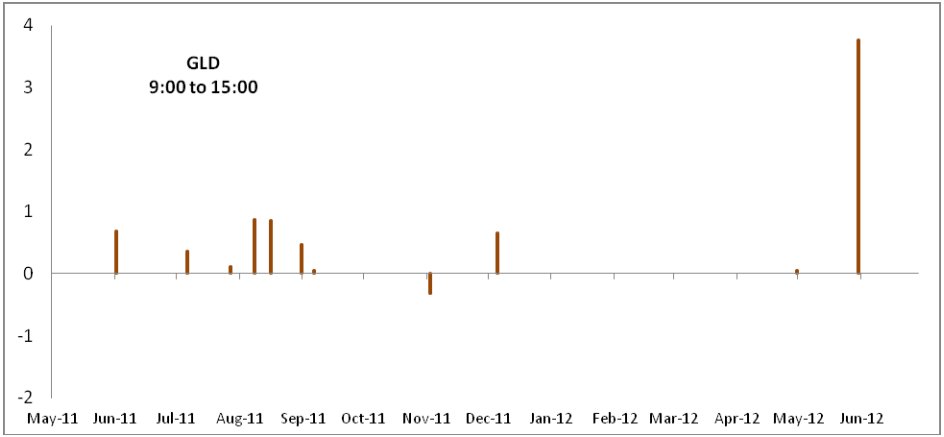
Fig 2
The column chart signifies the condition with an excessive loss in the spiders along with an early morning advance in GLD. When these two conditions were present, it gave the knowledgeable investor 10 advances against one decline, resulting in $7.58 in profits. This analysis has one obvious shortcoming; most of these trading opportunities came in the summer of 2011.
note! The recent (Jun 21, 2012) meltdown in equities (SPY -$3.04) came after the opening bell; therefore, it does not qualify for this system. An investment in precious metals was not able to defray your loss, as GLD slid $3.95. (GLD -$3.95)
conclusion: Before putting your money on the line, always ask more questions about the previous trading conditions. Anyone who craves definitive answers is in the wrong business, as investors the best we can do is trade with the percentages. Anyone who seeks answers to questions, examines the numbers and is willing to modify his or her views is going to sharpen their analytical skills and increase their knowledge. And, ultimately it is knowledge that is the gateway to long-term trading mastery over the markets.
Dr Anthony Trogone can be contacted by email at Dr Anthony Trogone
The conventional thinking among pundits supports taking a long position in this precious metal as a way of mitigating strong losses in the equities market. Fortunately, many active market participants prefer to run the numbers before acting on this long held assumption about market direction. This study attempts to prove or disprove this form of hedging strategy by performing an analysis on two active funds: the spiders (SPY), which are the best representation of the equities market (averaging 205 million shares per day), and the SPDR Gold Shares fund (GLD) with 15.7 million shares a day serves as our dependent variable.
In this study, our operational definition of a setback – within the previous 300 trading days (Apr 11, 2011 to Jun 19, 2012) – is a daily loss in excess of $1.00 in the spiders.
The findings show 65 days with a $1.00-plus loss in the spiders. On these days, were investors holding a long position in this precious metal fund profitable? Not really; the summary loss was -$22.98 (a 35¢ daily setback on a 100 share long position) with 32 wins against 33 losses. Apparently, gold bugs hedging against a strong downdraft in equities found this to be a poor insurance bet.
When making an assessment of excessive scores, a scatter gram displays more information regarding the past daily combinations of these two instruments. Below is a comparison of the spiders (X axis) with those 65 days with a loss in excess of $1.00, the performance of this gold fund (Y axis) is given in response to the daily loss in the spiders.
Fig1
Given this scatter chart, we can track how this gold fund reacts when the spiders drop 60 cents. For instance, in the upper left corner the spiders fell $7.82, whereas, the yellow metal had one of its best performances (Aug 8, 2011), finishing the day with a $4.28 advance. Apparently, it takes an excessive loss; more specifically, a loss of $3.20 or more, before this system experiences a profit.
On the 11 days with a <-$3.20 loss in the spiders, if you invested in this fund holding gold bullion in a vault in London, there were 7 advances against 4 declines, with $10.01 in profits. So, if we were to buy gold on these days we would make a nice daily profit, but there is one slight problem with this thinking, that is, we can’t trade the past. Consequently, we have to assess the performance of the spiders from an earlier timeframe in order for us to make decisions about the future direction of this yellow metal.
research question: If the spiders (SPY) drop 60-plus cents when trading from 6:00 to 9:00 in the morning, should we take a long position in GLD? More specifically, we would take a long position at 9:00, hold it, and offset it at 15:00 hours.
DATES OF STUDY: Jan 31, 2011 to Jun 19, 2012 (350 trading days).
GLD price:
Jan 31, 2011 its 9:00 price = $129.43.
Jun 19, 2012 its 15:00 price = $157.27
In these 350 trading days the frequency of a <- 60¢ drop in the spiders between the hours of 6:00 to 9:00 was not uncommon, there were 34 records found (9.71%). Since this condition occurs roughly once in every 10 trading days, an analysis of this condition is a meaningful endeavor.
In any case, the question remains, how did this gold fund perform under these conditions? In these 34 days, taking a long position from 9:00 to 15:00 provides the investor with $1.13 in profits; however, without a more introspective examination of your findings, you are doing yourself a disservice. Before rendering a final decision, always seek to ask more questions of your findings. For instance, answers to the following questions offer us more of an understanding regarding the parameters of this trading condition:
1) How does this $1.13 profit compare to the performance of this GLD fund when trading in this six-hour setting when the spiders do not have a 60-plus cent decline?
When not adopting this system, this fund had a cumulative loss of $9.42 in 316 days; however, it was capable of producing more winning trades with a record of 161 – 154 – 1. Seen from this perspective, the slight $1.13 advance in 34 trades begins to look more appealing.
2) When using this strategy, the results disregard the early morning direction of this GLD fund. If we refrain from taking a long position when this instrument either advances or declines from 6:00 to 9:00, does it enhance our performance results?
In this condition, we have two different categories both playing off the strong early morning loss in the spiders:
- An early morning loss (6:00 to 9:00) in excess of 60 cents in the spiders along with an advance in GLD.
- An early morning loss (6:00 to 9:00) in excess of 60 cents in the spiders along with a decline in GLD.
An examination of both of these conditions shows a performance discrepancy. When taking a long position from 9:00 until 15:00, an excessive early morning loss in the spiders AND an advancing three-hour session in this fund, was the more profitable category.
Fig 2
The column chart signifies the condition with an excessive loss in the spiders along with an early morning advance in GLD. When these two conditions were present, it gave the knowledgeable investor 10 advances against one decline, resulting in $7.58 in profits. This analysis has one obvious shortcoming; most of these trading opportunities came in the summer of 2011.
note! The recent (Jun 21, 2012) meltdown in equities (SPY -$3.04) came after the opening bell; therefore, it does not qualify for this system. An investment in precious metals was not able to defray your loss, as GLD slid $3.95. (GLD -$3.95)
conclusion: Before putting your money on the line, always ask more questions about the previous trading conditions. Anyone who craves definitive answers is in the wrong business, as investors the best we can do is trade with the percentages. Anyone who seeks answers to questions, examines the numbers and is willing to modify his or her views is going to sharpen their analytical skills and increase their knowledge. And, ultimately it is knowledge that is the gateway to long-term trading mastery over the markets.
Dr Anthony Trogone can be contacted by email at Dr Anthony Trogone
Last edited by a moderator: