In this article I will focus on the correlations of currency pairs and how they can help us trade. Occasionally, a trader may notice that a particular currency pair may lead another currency pair - that is, have turning points that happen a candlestick or two earlier. While it is rather rare for two different currency pairs to do EVERYTHING in the same way for long - be it trending or channelling - occasionally, we can be alerted to a potential turn in one pair when its dance partner turns first.
The first currency pair and its partner that we will examine is the EURUSD and the USDCHF. Before we examine the charts, always remember that with the USD on different sides in these two pairs, we have a reasonable Economics 101 belief that the charts will be heading in opposite directions at the same time. If the EURUSD is trending up, the US dollar is getting weaker versus the Euro, while in the USDCHF, a DOWNWARD trending chart is indicating a weakening US dollar versus the Swiss Franc. Looking at the following pair of charts, you will notice that the charts are generally headed in opposite directions. While they are not mirror images of each other, you will notice that they do have turning points on or near the same days. So how in the world can this help us trade?
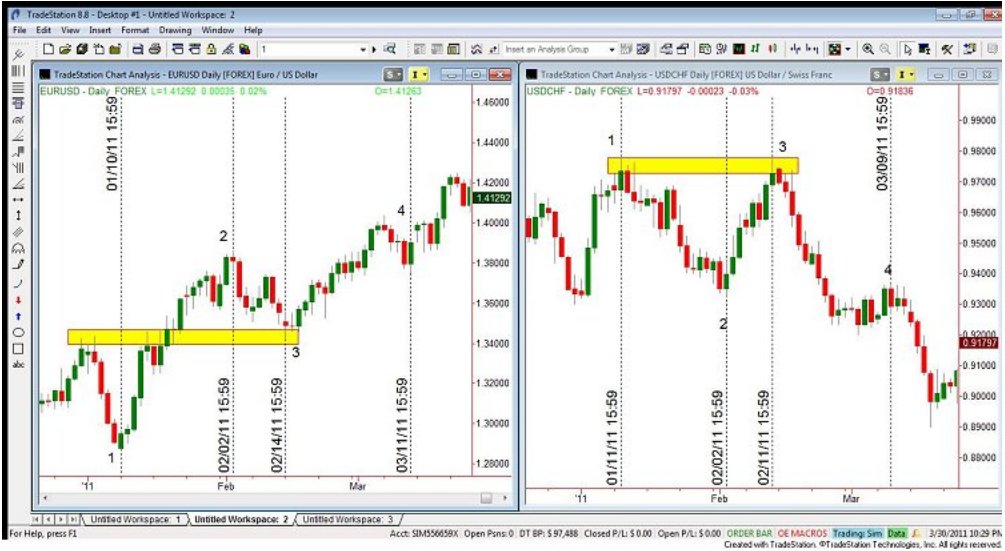
Figure 1
Looking at the first turning points labelled "1" on each chart, I marked the day with the swing low on the EURUSD and the corresponding swing high on the USDCHF. Notice how the USDCHF's swing high was a day later than the low on the EURUSD. If the USDCHF was at a supply zone where you were looking to sell short and you saw that its dance partner, the EURUSD, had already turned, this would certainly be an odds enhancer in your confidence level on the USDCHF short. The same idea is apparent at turning point labelled "3" on these charts. At this point, it looks as though the USDCHF had taken the lead where its swing high appeared on 2/11 and the swing low on the EURUSD came three days later on 2/14. Obviously, the supply zone on the USDCHF from 1/11 helped turn this pair down, while the demand zone on the EURUSD helped turn it to the up side. Knowing that the USDCHF had already turned a couple days earlier, would that help your confidence in taking the EURUSD long near "3?" I think it might!
At turning point labelled "4," the USDCHF was still leading this dance by two full days! Now, I will admit that these turns aren't always as obvious while they are happening as when looking back several days or weeks, but noticing the subtle differences in the daily highs and lows can give us the clues we are looking for. The last label on these two charts is "2." Both pairs had their corresponding swing high and low on the same day - I wanted to point out that nothing works every time. Make sure it is clear to you before you hit the buy or sell button!
So we've seen a few examples of daily charts and these two dance partners, but what if you are trading from smaller time frames? Let's examine these on an hourly chart.
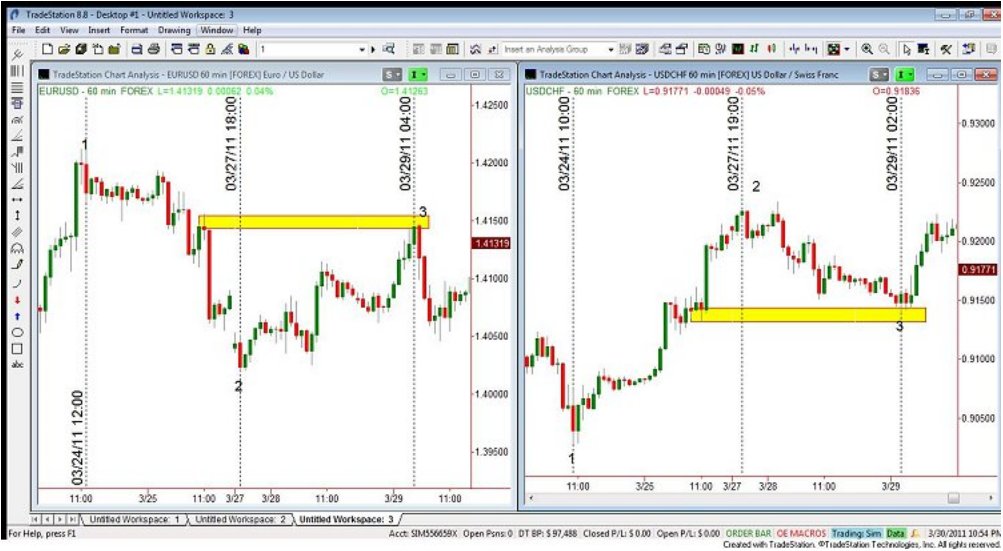
Figure 2
At the spots labelled 1 and 3, the USDCHF led its partner by a couple of hours when comparing swing highs to swing lows. If you were looking to sell the EURUSD at the yellow supply zone near label 3 noticing that the USDCHF was holding its own demand zone with an hourly low already placed two candles ago, would this help your confidence going short the EURUSD? On this chart, I labelled turning point "2" again to show that sometimes these currency pairs will take turns leading the dance - here the EURUSD turned a candle before the USDCHF. Nothing works all the time, every time!
There have been times in history when the EURUSD and the GBPUSD are close dance partners, also the AUDUSD and USDCAD. While there isn't enough room to show all of the possible examples that have ever happened, knowing that these can give us more confidence and lead to higher probability trades makes it worth back testing a few of these possible dance pair partners.
The first currency pair and its partner that we will examine is the EURUSD and the USDCHF. Before we examine the charts, always remember that with the USD on different sides in these two pairs, we have a reasonable Economics 101 belief that the charts will be heading in opposite directions at the same time. If the EURUSD is trending up, the US dollar is getting weaker versus the Euro, while in the USDCHF, a DOWNWARD trending chart is indicating a weakening US dollar versus the Swiss Franc. Looking at the following pair of charts, you will notice that the charts are generally headed in opposite directions. While they are not mirror images of each other, you will notice that they do have turning points on or near the same days. So how in the world can this help us trade?
Figure 1
Looking at the first turning points labelled "1" on each chart, I marked the day with the swing low on the EURUSD and the corresponding swing high on the USDCHF. Notice how the USDCHF's swing high was a day later than the low on the EURUSD. If the USDCHF was at a supply zone where you were looking to sell short and you saw that its dance partner, the EURUSD, had already turned, this would certainly be an odds enhancer in your confidence level on the USDCHF short. The same idea is apparent at turning point labelled "3" on these charts. At this point, it looks as though the USDCHF had taken the lead where its swing high appeared on 2/11 and the swing low on the EURUSD came three days later on 2/14. Obviously, the supply zone on the USDCHF from 1/11 helped turn this pair down, while the demand zone on the EURUSD helped turn it to the up side. Knowing that the USDCHF had already turned a couple days earlier, would that help your confidence in taking the EURUSD long near "3?" I think it might!
At turning point labelled "4," the USDCHF was still leading this dance by two full days! Now, I will admit that these turns aren't always as obvious while they are happening as when looking back several days or weeks, but noticing the subtle differences in the daily highs and lows can give us the clues we are looking for. The last label on these two charts is "2." Both pairs had their corresponding swing high and low on the same day - I wanted to point out that nothing works every time. Make sure it is clear to you before you hit the buy or sell button!
So we've seen a few examples of daily charts and these two dance partners, but what if you are trading from smaller time frames? Let's examine these on an hourly chart.
Figure 2
At the spots labelled 1 and 3, the USDCHF led its partner by a couple of hours when comparing swing highs to swing lows. If you were looking to sell the EURUSD at the yellow supply zone near label 3 noticing that the USDCHF was holding its own demand zone with an hourly low already placed two candles ago, would this help your confidence going short the EURUSD? On this chart, I labelled turning point "2" again to show that sometimes these currency pairs will take turns leading the dance - here the EURUSD turned a candle before the USDCHF. Nothing works all the time, every time!
There have been times in history when the EURUSD and the GBPUSD are close dance partners, also the AUDUSD and USDCAD. While there isn't enough room to show all of the possible examples that have ever happened, knowing that these can give us more confidence and lead to higher probability trades makes it worth back testing a few of these possible dance pair partners.
Last edited by a moderator: