Markets quite often exhibit tendencies that, for the astute trader, may translate into profits. One such tendency is what I refer to as the "rubber band effect." Markets tend to overshoot, similar to a rubber band that's stretched to its extreme and snapped back to its normal tension; so, too, do the markets. In mathematics, it's known as reversion to the mean. This theory is based on a phenomenon stating that when the price of any market deviates substantially away from its medium price, the odds are enhanced that it will revert or move back towards the average. This pattern is repeated quite often in the markets and is extremely worthwhile in identifying, as it may uncover some very attractive risk/reward opportunities.
The implications for designing a trading system around this thesis are quite good, as from my own experience it generates a higher than average success rate. In addition, when coupled with time frame analysis and sound execution rules, the odds are slightly improved.
Various indicators can be used to measure these "hyper-extensions;" the most common, and best known, are the Bollinger bands. I, however, for my trading, use a lesser-known band (which is very similar in many respects) named the Keltner channel. The primary differences between the two are that the Bollinger bands use standard deviation off a 20-period exponential moving average to calculate its bands, whereas the Keltner channel utilizes average true range (ATR) off a 20-simple moving average to calculate its envelope. I have found that the ATR function cuts out much of the lag associated with many of these indicators.
Upon rigorous back-testing, I've concluded that a 15-minute chart with inputs of 3 ATR yields a very good alerting system at getting "in the ballpark" of where price has a high chance of reverting back to the mean (the mean being the 20 SMA).
Highlighted in the yellow ellipses below are examples of how the channels actually gave alerts. Note that even in the downtrend, the market tended to move counter, and in some instances, the touching or moving outside of the bands was the impetus for some sharp reversals.
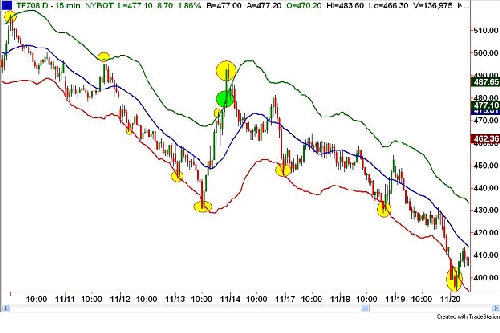
In this same chart (above), I've used a sample set of roughly 10 trading days. In this time frame, notice that a high percentage of the alerts did result in retracements (some more substantial than others), and one in particular (highlighted in the lime green ellipse) did fail. Indeed, every methodology must fail a certain percentage of the time - that's the nature of trading.
What I need to emphasize here is that this is an ALERT, not a trigger for putting on a trade. The trade comes after an identification of a longer- term (substantial) support or resistance. As far as I'm concerned, any entry has to be predicated on price levels where "buyers and sellers" have previously amassed. The tricky part is finding levels that carry the highest odds - in the context of different scenarios - such as trends, range-bound, and extended markets.
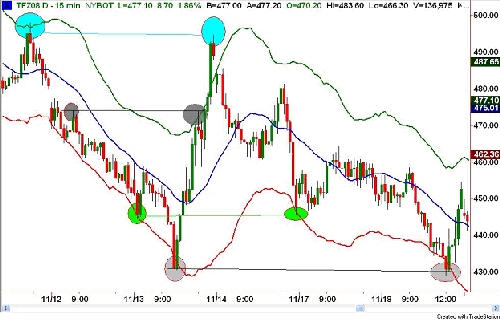
In the chart below, I've zoomed in and highlighted four of these alerts in order to show that these trades only worked if placed in the aforementioned support and resistance.
The way I set-up trades utilizing the Keltner channel is by adhering to the following set of rules:
1) I will only trade countertrend if price has TOUCHED or BREACHED the bands. (Prior to this, I only trade in the direction of the prevailing trend.)
2) I will only put on the trade if or when I have identified a substantial (bigger time frame) support or resistance level.
3) I will place a limit order at or below (to compensate for momentum and nuances) support or resistance, with a 15-tick stop-loss attached.
4) Once the order is placed, I will not change, cancel, or replace it until it fills and has moved 15 ticks in my favor. I WILL ACCEPT THE OUTCOME without any NEGATIVE repercussion to my mental state of mind.
In the last few newsletters, I've written about risk-reward, thinking in probabilities, and accepting risk. Subsequently, I received lots of emails asking me to elaborate on these topics. What I've tried to do here is give readers a sampling of what a LOW RISK, HIGH REWARD, HIGH PROBABLITY, methodology looks like. Additionally, I want to emphasize that an integral part of any trading system is having a simple set of rules. These have been spelled out verbatim right from my trading journal.
Now, I'm not suggesting you go out and trade this methodology. What I would suggest though, is that you go do some of your own analysis until you find something that works for YOU. Formulate some SIMPLE execution rules, and follow these rules as though your livelihood depended on it, because it does.
If you do this, you will be a step ahead of the majority of traders out there. Then, and only then, will you begin your path to becoming a PROFESSIONAL TRADER.
Until next time, I hope everyone has a profitable week.
The implications for designing a trading system around this thesis are quite good, as from my own experience it generates a higher than average success rate. In addition, when coupled with time frame analysis and sound execution rules, the odds are slightly improved.
Various indicators can be used to measure these "hyper-extensions;" the most common, and best known, are the Bollinger bands. I, however, for my trading, use a lesser-known band (which is very similar in many respects) named the Keltner channel. The primary differences between the two are that the Bollinger bands use standard deviation off a 20-period exponential moving average to calculate its bands, whereas the Keltner channel utilizes average true range (ATR) off a 20-simple moving average to calculate its envelope. I have found that the ATR function cuts out much of the lag associated with many of these indicators.
Upon rigorous back-testing, I've concluded that a 15-minute chart with inputs of 3 ATR yields a very good alerting system at getting "in the ballpark" of where price has a high chance of reverting back to the mean (the mean being the 20 SMA).
Highlighted in the yellow ellipses below are examples of how the channels actually gave alerts. Note that even in the downtrend, the market tended to move counter, and in some instances, the touching or moving outside of the bands was the impetus for some sharp reversals.
In this same chart (above), I've used a sample set of roughly 10 trading days. In this time frame, notice that a high percentage of the alerts did result in retracements (some more substantial than others), and one in particular (highlighted in the lime green ellipse) did fail. Indeed, every methodology must fail a certain percentage of the time - that's the nature of trading.
What I need to emphasize here is that this is an ALERT, not a trigger for putting on a trade. The trade comes after an identification of a longer- term (substantial) support or resistance. As far as I'm concerned, any entry has to be predicated on price levels where "buyers and sellers" have previously amassed. The tricky part is finding levels that carry the highest odds - in the context of different scenarios - such as trends, range-bound, and extended markets.
In the chart below, I've zoomed in and highlighted four of these alerts in order to show that these trades only worked if placed in the aforementioned support and resistance.
The way I set-up trades utilizing the Keltner channel is by adhering to the following set of rules:
1) I will only trade countertrend if price has TOUCHED or BREACHED the bands. (Prior to this, I only trade in the direction of the prevailing trend.)
2) I will only put on the trade if or when I have identified a substantial (bigger time frame) support or resistance level.
3) I will place a limit order at or below (to compensate for momentum and nuances) support or resistance, with a 15-tick stop-loss attached.
4) Once the order is placed, I will not change, cancel, or replace it until it fills and has moved 15 ticks in my favor. I WILL ACCEPT THE OUTCOME without any NEGATIVE repercussion to my mental state of mind.
In the last few newsletters, I've written about risk-reward, thinking in probabilities, and accepting risk. Subsequently, I received lots of emails asking me to elaborate on these topics. What I've tried to do here is give readers a sampling of what a LOW RISK, HIGH REWARD, HIGH PROBABLITY, methodology looks like. Additionally, I want to emphasize that an integral part of any trading system is having a simple set of rules. These have been spelled out verbatim right from my trading journal.
Now, I'm not suggesting you go out and trade this methodology. What I would suggest though, is that you go do some of your own analysis until you find something that works for YOU. Formulate some SIMPLE execution rules, and follow these rules as though your livelihood depended on it, because it does.
If you do this, you will be a step ahead of the majority of traders out there. Then, and only then, will you begin your path to becoming a PROFESSIONAL TRADER.
Until next time, I hope everyone has a profitable week.
Last edited by a moderator: