I'd like to walk you through a trade that was placed in October, using a technique that might seem a little unusual - the use of intra-market relationships and correlations to create trading opportunities in the Forex market. Sound complicated? It's really not, so please sit back and enjoy as we explore the use of the stock market as a leading indicator to trade Forex.
On Monday, October 13, 2008, the Dow Jones Industrial Average skyrocketed to its biggest point gain ever, a whopping 936 point move. The 11.1% gain was the biggest in percentage terms since 1933, and the fifth largest percentage gain in the history of the index. Similar moves were also seen on the S&P 500 and the NASDAQ, as the markets celebrated the end of capitalism as we know it. Now that the U.S. Treasury is buying bank stocks, I guess I should congratulate you, since you and I are now are the owners (through the use of our hard earned tax dollars) of stock in many of the nation's beleaguered financial institutions. Congrats, comrade!
The next morning, on Tuesday October 14, the markets were bidding up sharply again, after closing near their highs on the previous day's rally. A little bit of leftover euphoria if you will, but all was not well. If the government is now backing the banks, then why wasn't the TED Spread responding in kind by falling back to earth from its record levels? The TED spread measures the difference between the 3-month Libor and the 3-month Treasury bill, and is a key indicator of risk. The higher the TED spread, the greater the aversion to risk (for more information on the Ted Spread, click here).
Despite the bailout, the TED spread, while off of its record highs, was still above 4%. Why were banks still charging other banks in excess of 4% above the going rate of a 3-month T-Bill for loans? What were they afraid of? Could it be that fear and loathing of this rescue plan was lurking just beneath the surface? Clearly, something wasn't right. The VIX (Volatility Index) also indicated that fear levels were high. It seemed that the public was buying into the rally, while the institutional side remained leery of the bailout package.
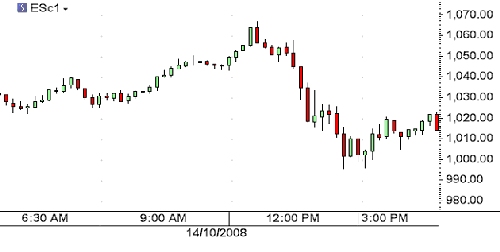
As the rally carried through and the indices shot higher once again, I wondered if we would see the market sputter after the initial excitement wore off. Many orders for the open of trading came rolling in from an excited public, taking advantage of the opportunity to pick up some Apple or Google at what they believed to be bargain prices. Stocks opened higher but after all of these orders were filled, the chance of a reversal seemed pretty high, when considering the previous day's gains and today's bullish open. The fact that the TED Spread remained relatively high seemed to confirm this outlook, as not everyone seemed to be buying into the idea that all of the market's problems had been solved. Looking at the 15 minute chart of the E-Minis, there clearly was a reversal taking shape. Please note that my charts reflect Greenwich Mean Time (GMT), which is used almost universally by Forex traders and is five hours ahead of U.S. Eastern time, the time zone in which the trade occurred (see figure 1).
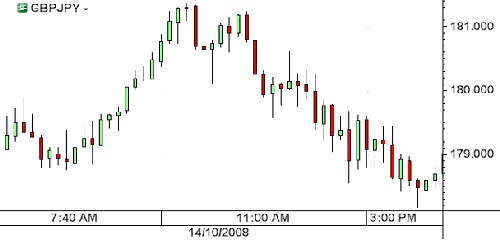
The fact that the equity markets were setting up for a reversal is useful information to currency traders. The strong correlation that exists between equity markets and currency pairs such as GBP/JPY and EUR/JPY meant that the table was being set for a reversal in those pairs as well. Like the Dow and the S&P, the GBP/JPY and EUR/JPY were experiencing wicked rallies in the midst of a bear market. The short covering rally was fierce, but it was coming to an end. My students and I spent about 30 minutes plotting a course of action as we kept a close eye on the stock markets, using the stock indexes as a leading indicator. We carefully planned our entry, stop, and exit, and we shorted GBP/JPY just as it was coming off of a peak. We placed a stop above the recent high, near 181.60.
As the stock markets began to fade, GBP/JPY dutifully rolled over and followed - it even formed a miniature double top, a bearish pattern formation that often precedes a sharp selloff. Then the currency pair began a steady march south, racking up gains of over 200 pips over the next few hours before hitting our exit, just above a major support level. Then it was off to the restaurant for some lunch - not a bad way to spend the morning (see figure 2).
It was a good trade, made even better by the fact that we were all in it together. All of the students had input the entry, stop, and exit orders just as we had planned them, and our exits were all hit simultaneously as we were getting up from our stations and preparing to drive to a nearby sushi restaurant. It gives me great pleasure to see students who are new to Forex tearing off a 200-plus pip gain in a couple of hours, and if it made me happy, just imagine how they felt about it. For many of them it confirmed that with the proper training, along with careful observation and guidance, it is possible to trade the Forex market successfully.
On Monday, October 13, 2008, the Dow Jones Industrial Average skyrocketed to its biggest point gain ever, a whopping 936 point move. The 11.1% gain was the biggest in percentage terms since 1933, and the fifth largest percentage gain in the history of the index. Similar moves were also seen on the S&P 500 and the NASDAQ, as the markets celebrated the end of capitalism as we know it. Now that the U.S. Treasury is buying bank stocks, I guess I should congratulate you, since you and I are now are the owners (through the use of our hard earned tax dollars) of stock in many of the nation's beleaguered financial institutions. Congrats, comrade!
The next morning, on Tuesday October 14, the markets were bidding up sharply again, after closing near their highs on the previous day's rally. A little bit of leftover euphoria if you will, but all was not well. If the government is now backing the banks, then why wasn't the TED Spread responding in kind by falling back to earth from its record levels? The TED spread measures the difference between the 3-month Libor and the 3-month Treasury bill, and is a key indicator of risk. The higher the TED spread, the greater the aversion to risk (for more information on the Ted Spread, click here).
Despite the bailout, the TED spread, while off of its record highs, was still above 4%. Why were banks still charging other banks in excess of 4% above the going rate of a 3-month T-Bill for loans? What were they afraid of? Could it be that fear and loathing of this rescue plan was lurking just beneath the surface? Clearly, something wasn't right. The VIX (Volatility Index) also indicated that fear levels were high. It seemed that the public was buying into the rally, while the institutional side remained leery of the bailout package.
As the rally carried through and the indices shot higher once again, I wondered if we would see the market sputter after the initial excitement wore off. Many orders for the open of trading came rolling in from an excited public, taking advantage of the opportunity to pick up some Apple or Google at what they believed to be bargain prices. Stocks opened higher but after all of these orders were filled, the chance of a reversal seemed pretty high, when considering the previous day's gains and today's bullish open. The fact that the TED Spread remained relatively high seemed to confirm this outlook, as not everyone seemed to be buying into the idea that all of the market's problems had been solved. Looking at the 15 minute chart of the E-Minis, there clearly was a reversal taking shape. Please note that my charts reflect Greenwich Mean Time (GMT), which is used almost universally by Forex traders and is five hours ahead of U.S. Eastern time, the time zone in which the trade occurred (see figure 1).
The fact that the equity markets were setting up for a reversal is useful information to currency traders. The strong correlation that exists between equity markets and currency pairs such as GBP/JPY and EUR/JPY meant that the table was being set for a reversal in those pairs as well. Like the Dow and the S&P, the GBP/JPY and EUR/JPY were experiencing wicked rallies in the midst of a bear market. The short covering rally was fierce, but it was coming to an end. My students and I spent about 30 minutes plotting a course of action as we kept a close eye on the stock markets, using the stock indexes as a leading indicator. We carefully planned our entry, stop, and exit, and we shorted GBP/JPY just as it was coming off of a peak. We placed a stop above the recent high, near 181.60.
As the stock markets began to fade, GBP/JPY dutifully rolled over and followed - it even formed a miniature double top, a bearish pattern formation that often precedes a sharp selloff. Then the currency pair began a steady march south, racking up gains of over 200 pips over the next few hours before hitting our exit, just above a major support level. Then it was off to the restaurant for some lunch - not a bad way to spend the morning (see figure 2).
It was a good trade, made even better by the fact that we were all in it together. All of the students had input the entry, stop, and exit orders just as we had planned them, and our exits were all hit simultaneously as we were getting up from our stations and preparing to drive to a nearby sushi restaurant. It gives me great pleasure to see students who are new to Forex tearing off a 200-plus pip gain in a couple of hours, and if it made me happy, just imagine how they felt about it. For many of them it confirmed that with the proper training, along with careful observation and guidance, it is possible to trade the Forex market successfully.
Last edited by a moderator: