Is there a correlation between Crude Oil Futures and the Dow? And can this correlation be quantified?
In my August 30, 2006 market summary, I wrote how "we would be foolish not to avail ourselves of the inverse pricing relationship between crude-oil and the Dow Jones Industrial Average." Since then, the price of crude has fallen $6.35 and the Dow is 227 points to the upside.
But, now that the distance between these two indicators appears to be excessive, will this wide discrepancy begin to shrink?
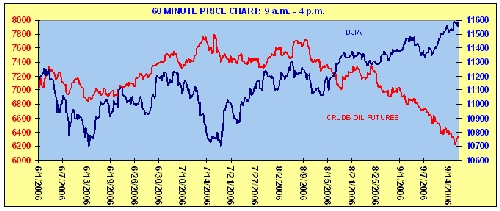
In August, energy prices were approaching $80 a barrel, the major equity indices were flat, but as the continuous NYMEX light sweet crude-oil futures contract (CL #F) was sputtering, the markets began spurting upwards. If you compare the 60-minute pricing between crude-oil with the Dow Jones Industrial Average there was a strong inverse correlation (-.616), which demonstrates the persuasive influence of crude prices on the market.
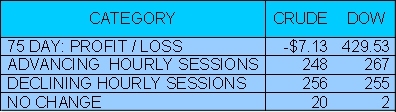
Although the Dow pushed ahead 429.53 points in the previous 75 trading days (Jun1, 2006 - Sep 15, 2006), most of gains came after the crude-oil futures contract could not penetrate resistance (August 9, 2006). Thereafter, the contract began to drop rapidly (from 7715 to 6339); however, the Dow's reaction was very positive - gaining 352.43 points in 27 trading days.
In this article, as we further investigate the impact of the recent plunge in crude-oil prices and we answer specific questions, it will supplement our understanding of how the Dow interacts with this fashionable inflation gauge. According to today's financial papers, the decrease in energy prices will be a boost for consumer spending: fueling the Dow into record territory.
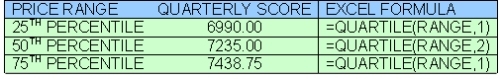
In the 75 trading days, the continuous crude-oil contract had the following hourly price range (9 a.m. to 4 p.m. ET):
If you are trading the market on the basis of current energy prices, some of the more meaningful performance questions are:
Since there is a strong inverse correlation between these two highly popular indicators, an awareness of how they function simultaneously can certainly fortify your know-how as a day-trader.
THESE RESULTS EXCLUDE THE OVERNIGHT TRADING SESSION
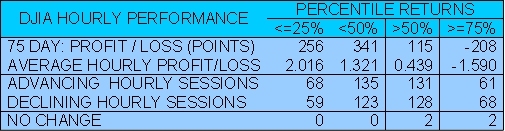
A 341 point advance (79.36% of the overall gain) in the Dow came when the price of crude was below its median score (7235). In looking at the contrast between the two quarterly extremes, there was a substantive 256 point advance (59.59% of the overall gain) in the lower percentile, but a 208 point loss when the price of light sweet crude began trading the hourly session in the upper percentile.
If you were able to accurately predict the hourly price of crude, how would this affect your decision to invest in the equities market? Without considering the current price of crude, would you take an opposite trading position in the same hourly session?
This strategy can be seen below:
The performance of this trading strategy can be seen on the hourly results of these two indicators on Sep 15, 2006.
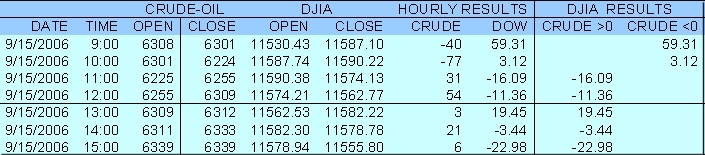
On September 15, the more logical strategy would have you buying as crude fell, but selling as it began rising in price. With the exception of the 13:00 hour, the table confirms this strategy: As crude fell in the opening two-hours of trading the Dow posted a 62 point gain; but as crude began rising throughout the day the Dow saw some profit taking.
Nevertheless, the results of 524 hourly sessions tell us a different story:
Certainly the findings are counterintuitive, especially when considering the strong inverse correlation. The small percentage difference in an advancing or declining hourly session indicates that large price fluctuations are skewing our results. Seen from this perspective, a more extensive analysis is required. Apparently, we still have a long way to go in order to uncover the various interactions between these two indicators. Watch for upcoming articles, but until then we have some suggestive facts to act upon.
In my August 30, 2006 market summary, I wrote how "we would be foolish not to avail ourselves of the inverse pricing relationship between crude-oil and the Dow Jones Industrial Average." Since then, the price of crude has fallen $6.35 and the Dow is 227 points to the upside.
But, now that the distance between these two indicators appears to be excessive, will this wide discrepancy begin to shrink?
In August, energy prices were approaching $80 a barrel, the major equity indices were flat, but as the continuous NYMEX light sweet crude-oil futures contract (CL #F) was sputtering, the markets began spurting upwards. If you compare the 60-minute pricing between crude-oil with the Dow Jones Industrial Average there was a strong inverse correlation (-.616), which demonstrates the persuasive influence of crude prices on the market.
Although the Dow pushed ahead 429.53 points in the previous 75 trading days (Jun1, 2006 - Sep 15, 2006), most of gains came after the crude-oil futures contract could not penetrate resistance (August 9, 2006). Thereafter, the contract began to drop rapidly (from 7715 to 6339); however, the Dow's reaction was very positive - gaining 352.43 points in 27 trading days.
In this article, as we further investigate the impact of the recent plunge in crude-oil prices and we answer specific questions, it will supplement our understanding of how the Dow interacts with this fashionable inflation gauge. According to today's financial papers, the decrease in energy prices will be a boost for consumer spending: fueling the Dow into record territory.
In the 75 trading days, the continuous crude-oil contract had the following hourly price range (9 a.m. to 4 p.m. ET):
If you are trading the market on the basis of current energy prices, some of the more meaningful performance questions are:
What was the Dow's performance when crude-oil was trading below its 25 percentile?
What was the Dow's performance when crude-oil was trading below its 50 percentile?
What was the Dow's performance when crude-oil was trading above its 50 percentile?
What was the Dow's performance when crude-oil was trading above its 75 percentile?
Since there is a strong inverse correlation between these two highly popular indicators, an awareness of how they function simultaneously can certainly fortify your know-how as a day-trader.
THESE RESULTS EXCLUDE THE OVERNIGHT TRADING SESSION
A 341 point advance (79.36% of the overall gain) in the Dow came when the price of crude was below its median score (7235). In looking at the contrast between the two quarterly extremes, there was a substantive 256 point advance (59.59% of the overall gain) in the lower percentile, but a 208 point loss when the price of light sweet crude began trading the hourly session in the upper percentile.
If you were able to accurately predict the hourly price of crude, how would this affect your decision to invest in the equities market? Without considering the current price of crude, would you take an opposite trading position in the same hourly session?
This strategy can be seen below:
CRUDE-OIL HOURLY PRICE >0 = TAKING A LONG POSITION IN THE DOW
CRUDE-OIL HOURLY PRICE <0 = TAKING A SHORT POSITION IN THE DOW
CRUDE-OIL HOURLY PRICE =0 = TAKING NO POSITION IN THE DOW
The performance of this trading strategy can be seen on the hourly results of these two indicators on Sep 15, 2006.
On September 15, the more logical strategy would have you buying as crude fell, but selling as it began rising in price. With the exception of the 13:00 hour, the table confirms this strategy: As crude fell in the opening two-hours of trading the Dow posted a 62 point gain; but as crude began rising throughout the day the Dow saw some profit taking.
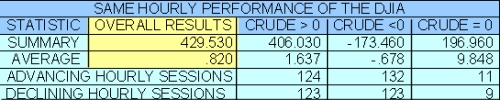
Nevertheless, the results of 524 hourly sessions tell us a different story:
Certainly the findings are counterintuitive, especially when considering the strong inverse correlation. The small percentage difference in an advancing or declining hourly session indicates that large price fluctuations are skewing our results. Seen from this perspective, a more extensive analysis is required. Apparently, we still have a long way to go in order to uncover the various interactions between these two indicators. Watch for upcoming articles, but until then we have some suggestive facts to act upon.
Last edited by a moderator: