leprivatebanker
Newbie
- Messages
- 2
- Likes
- 0
My aim with this trading journal is to offer valuable market insights based in auction market theory. Through this journal, I will look into advanced analyses of key indicators such as VWAP, Volume Profile and footprint (volume at price, numbers bars) which is basically order flow analysis. By sharing this knowledge, I hope to enhance your understanding and use of this specific trading approach.
We will begin by discussing the post from Friday and continue to provide additional free content that can be useful and supportive on my and your trading journey.
Update from Friday, June 16:
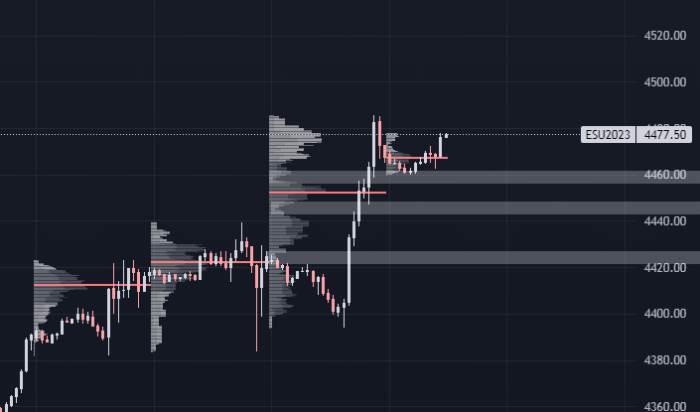
The E-mini S&P 500 is trading around $4477, showing a slight increase of about 0.1% during the early European trading session. The market’s behavior appears to be influenced by the rollover date for today’s session. However, the calculations for the session are mixed, indicating a potential for a balanced market. The median-term perspective is supported by lower volatility and a combination of a weaker dollar.
Yesterday’s volume profile revealed a multiple distribution structure, suggesting that buyers were active around the upper area of the first lower volume zone today. On the other hand, sellers may target the next lower volume area to find absorption for core long positions. The current profile indicates some interest in higher prices, but it’s worth noting that the swing highs could act as a selling level, potentially leading to a pullback scenario.

Furthermore, the market is trading above the developing value area and may aim for the lower VWAP close level, attracting buyers during the New York trading session. The prevailing bullish momentum has the potential to drive the market higher.
Considering the current contango, prices for the front-month contract might increase. However, investors must carefully assess the direction in which prices are adjusting for today’s rollover date, as it could trigger a volatile market environment.
- Now we can compare the past trading day with the analysis of this post.
We will begin by discussing the post from Friday and continue to provide additional free content that can be useful and supportive on my and your trading journey.
Update from Friday, June 16:
The E-mini S&P 500 is trading around $4477, showing a slight increase of about 0.1% during the early European trading session. The market’s behavior appears to be influenced by the rollover date for today’s session. However, the calculations for the session are mixed, indicating a potential for a balanced market. The median-term perspective is supported by lower volatility and a combination of a weaker dollar.
Yesterday’s volume profile revealed a multiple distribution structure, suggesting that buyers were active around the upper area of the first lower volume zone today. On the other hand, sellers may target the next lower volume area to find absorption for core long positions. The current profile indicates some interest in higher prices, but it’s worth noting that the swing highs could act as a selling level, potentially leading to a pullback scenario.

Furthermore, the market is trading above the developing value area and may aim for the lower VWAP close level, attracting buyers during the New York trading session. The prevailing bullish momentum has the potential to drive the market higher.
Considering the current contango, prices for the front-month contract might increase. However, investors must carefully assess the direction in which prices are adjusting for today’s rollover date, as it could trigger a volatile market environment.
- Now we can compare the past trading day with the analysis of this post.

