Details of my strategy
For a few years now i have been trading the markets part time.
I recently been putting a lot more thought into it.
around 10+ years ago i put my first MA on a chart and since then been looking the the markets technically. It is so funny..that after using tons of different indicators, systems and strategies, reading books, and watching DVD's about the markets.. right now i have ended up with a MA for my indicator.
At one point a few years ago i was deeply immersed in Fib. I studied it a couple years but really not satisfied with the result.
I am not using any fancy software now, but i was using tradestation and DT before.
Right now it is the free software which comes with the FXCM trading software. It has more than i need.
My Test system.
My strategy is basically to take long positions in pullbacks in an uptrend.
I use the Daily chart to check the direction of the trend and the use the minute chart to make the trades. how ever one doesnt really need the minute charts as you will see why later.
I was looking for different ways to define a trend..tried different indicators but wanted something real simple. The HH and LH doesnt work for me, because it can and will require some judgement . Just wanted to be able to glance at a chart and know exactly which way i will be trading, No trendlines,fib, s/r... nothing.
So this was it.
The decision was just to add 2 EMA's and when the short EMA is above the long EMA then go Long and Vice Versa. Very very simple.
Next thing was this, when in a trend should i take a position?
higher high ? ( by this i mean the HH within the particular trend defined which i have mentioned), or buy above the high of the last bar? or this or that?. I tried different ways, but not completely satisfied.
So i decided that the best time to take long positions is when the price is below the EMAs while in an uptrend, and vice versa. This now created 2 more problems for me. first is if the price keeps going lower, then when should my system tell me when i am wrong? By the time the EMA crosses down, the price may be a long way down, what should my SL be? I needed to find how i can find the lowest price possible in a retracement, and still be out of the market soon enough when i am wrong.
This was the first problem. The second was when the market goes rangebound...the EMA's practically go flat or keep crossing and killing. And I still wanted to continue trading the signals.
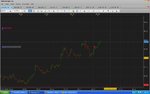
The solution for me I found out would be to use the same EMA's but for the low and high of the daily bars rather than the closes. This would mean the EMA's are following the lows and highs of the day. So at this point I now need 4 EMA's on my daily charts.
13 day EMA of high
21 day EMA of high
13 day EMA of low
21 day EMA of low
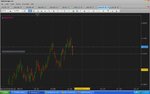
What this does now is if the price crosses below the 21 day EMA LOW in an uptrend, it would be at a much lower price, and at the same time, if the EMA crosses over, the losses will be a lot less. The same for a downtrend. I was satisfied with this.
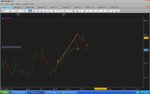
Now how would it perform in a non trending market?.
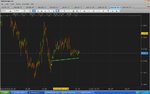
When you place the MA's on a non trending market, the MA's create a "floating" S/R line.
which worked perfect to me, because i would not be trading between the two pairs of EMA's, Therefore minimal or no losses.
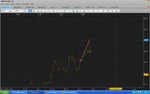
This created yet another problem..Where should my PT be?, In a trending market, i need to be in as long as possible, if I did this in a range bound market, the market will keep coming back and stopping me out. So I made a decision that, the PT will be once the price crosses the shorter EMA HIGH, I exit. Even in a trending market.
So just to repeat, In an uptrend ( the 13 EMA low is above the 21 EMA low), and the price crosses below the 21 EMA low, then prepare to go long, if the 13 EMA low crosses below the 21 EMA low, then exit. if the market goes your way, then exit when the price crosses the 13 EMA high.
As many or all of you probably know the strength and limitations of indicators. Sometimes they work, and sometimes they don't. The intention here is when they do work, is try to squeeze out as many pips as possible from the market, and when it doesnt, i need to exit with as small a loss as possible.
But how was i to achieve this? This would probably mean that I would need more winners than losers, or less winners with huge gains, and small losses. All of you reading know this. Calculating RR seemed too complicated especially, when I am pyramiding, and I didnt want to get too mathematical.
I for one assume there is a 50/50 chance the market will go in either direction.
At any moment the market can go X amount up or the same X amount down.
This would mean no advantage for me. If this is the case, then if i went long and the market went against me to X amount, I would lose Y dollars, and make Y dollars if it went the same X amount my way. What I needed is that if the market went X amount my way, then I should make y dollars + some more. How do I cut my losses?, Maybe I thought that if i cant find practical ways to cut my losses then best way is to increase my gain in any given trade. This is the reason for my pyramiding.
wow...I don't think I have ever written this much since my school days..
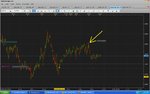
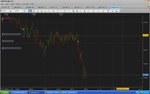
Now I asked myself..., but what about the times, when the market is moving strong, and doesnt retrace enough to trigger a signal?, and if it did retrace, then How would i take advantage of the trend if i decided to take profit when the price crosses the 13 EMA high ( in an uptrend), When do I pyramid?, when do I add to existing positions?.
This I will continue some other time, very tired..need to sleep.
Exiting the AUDUSD trade..do want any open trades today while i am sleeping.
later