JahDave
Experienced member
- Messages
- 1,563
- Likes
- 28
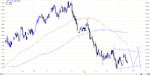
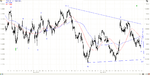
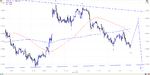
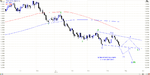
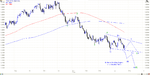
I am starting this thread because I have been studying Elliott Wave theory for almost two years now and I would like to know if anyone else here is using it, and if so I would like some input. Also, for new traders I hope this thread will help you make some profitable trades even if you can't contribute right now. My first post will be a long term chart that is labeled and I will also post a shorter term chart that is labeled. One of the things I like most about Elliott Wave is that it is based on a fractal scale, so it is happening on all time frame charts. So here is what I think is happening long term and shorter term.