Touch, pause, engage!

gododdin

Member
Messages
63
Likes
8
Hello, and welcome to the first instalment of my trading journal. First the title – I’m from Wales and proud of it, and we won the rugby Grand Slam today (well done boys!) so it seemed appropriate. But also I thought it nicely summed up the cautious but robust way I’d like to learn to trade! The phrase 'touch, pause, engage!' is given to players from the two sides by the referee just before they go head to head in a 'scrum'.

I suppose I should start with a little context. First off, I’m in the UK so most of what I write will be relevant to UK markets, but I guess that the principles are the same wherever you trade, the probable exception being spread betting, which I don’t think is available e.g. in the US. Secondly, you’ve heard about financial and market ‘gurus’ who know everything there is to know about trading? Well, I’m the opposite, in that I know very little indeed. And as such I feel like a minnow swimming in shark-infested waters…

A short while ago (Christmas 2007) I knew as much about trading as I know about nuclear physics! Three months and masses of reading and experimenting later I know a little more – but you know what they say about a ‘little knowledge’ being a dangerous thing! In truth, I filled a whole Moleskine notebook with notes (and I write small!), but I don’t feel a lot wiser, just chock-full of information swimming around in my head with seemingly no way to ‘connect the dots’ properly.

In this journal I’m going to try to be as honest as possible, which means that I’m probably (no, definitely!) going to look pretty stupid at times. But as I see it, this journal will ONLY be of value to me or anyone else if it’s an honest account. So if you’re looking to make a million quickly and you already know how to do it I doubt you’ll find much of interest here. But if you’re just starting out too and you want to learn with me and from my mistakes, then welcome. Also if you’re an expert and you can see a way to give me a nudge in the right direction now and then, well, that’s great too. I’m not sure if I can do it yet, but if I can, then surely ANYONE can, because nobody could possibly know less than I did just a little while ago.

How and why did I get started? The short version is that I went to see a financial advisor friend of mine late in 2007 and asked him whether, as a reasonably intelligent human being there was a way that I could supplement my pathetically small pension fund? I didn’t want to get rich quick (I still have 14 years before I retire) and I wasn’t afraid of some hard graft, but I just needed a direction and a methodology. He lent me a book called Champion Trader which I read and re-read until I understood it. I quickly realised that if you took away all the background this was actually pretty simple stuff… Hey, maybe I could do this and it wasn’t beyond me after all… Hmmm?

So I set about trying to find a strategy that would suit me. I work full time right now, so I knew I needed a method/strategy that didn’t require me to sit in front of a computer all day long. On the other hand I don’t have the patience to hold onto open trades for weeks or months. So an intermediate time scale seemed best for me. I then discovered ‘swing trading’ and immediately felt that, at least for now, the 1-5 or so days timescale that it offered suited me well.

Then I started casting around in an attempt to decide what to trade. The trouble is I was looking from a position of complete ignorance, and each new website, article or book I read seemed to sway me in a different direction. Some said trade only indices, others that I should stick to FTSE100 stocks, still others that the DJIA companies would be best, or FTSE250 or FX (I had no idea what that was, even, at the time) so I just got more and more confused.

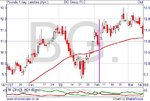
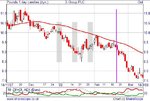
At the same time I was trying out various charting services online, like Bigcharts (I read about them in Champion Trader) and StockCharts (which I liked better). Simply on the basis that I liked the look of StockCharts, and they don’t do UK stocks, I decided I’d try my hand at trading US stocks and to keep it simple I thought I’d just go for the big ones – the DOW30. This of course would be paper trading to start with, because although I’m green, I’m not that keen to part with my hard-earned! And because I’d read the book and it seemed a simple approach I would start with the Champion Trader method.

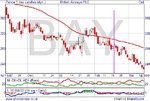
Basically I set up a 14 day EMA and 3 months of daily candles, when the 14 day EMA turned from down to up it generated a long signal and when it turned from up to down it generated a short signal. It all seemed soooo simple, and boy was I going to make a fortune… The trouble was that the stocks I was scanning never seemed to do what it said in the book. For days and weeks the 14 period EMA seemed either to float horizontally or wobble like a gentle Atlantic swell. I quickly became disillusioned and searched for another strategy. I then discovered crossing moving averages and this seemed much more sensible – a definite change of trend signal! Woohoo! At last something definite in this sea of uncertainty! But whenever I tried it, it never seemed to work. So again I began to search for the ‘Holy Grail’ and just like the Grail quest mine seemed never ending. I tried strategies based on MACD, on Wilder’s ADX, on Fibonacci Retracements. In the end it all became too much and I almost threw in the towel. I was suffering from information overload, from ‘paralysis by analysis’, and I needed a rest from it all.

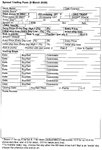
And then I read somewhere that it wasn’t the systems that were at fault it was ME! And this made a lot of sense. I set about writing a Trading Plan (which is not the same as a strategy) and it made a big difference. I realised how woolly I had been in my thinking and I set about designing my own system (based on what I considered – given my current state of knowledge - to be the best elements of several strategies I’d read about). The system would have really good money-management built in so that my risks were minimised and every effort would be made to remove the emotional element that could be so destructive. Above all, the system had to be simple, because as someone said, ‘…individuals are complex, but the behaviour of the crowd is simple.’ I was going to try to beat the crowd, and not be motivated, as it was, by greed and fear.

Please tell me if I’ve left something you consider to be essential out of the above introductory narrative. In the next installment I’ll go on to detail ‘my’ strategy and money management, and then we’ll look at some real life examples of paper trades, where I went wrong and, hopefully, where I eventually go right.
 
Agreed. I'm glad you're not following the Champion Trader plan ... it was discussed in depth in this thread Champion Trader Commercial System and although it seems to have some reasonable principles the "champion" bit is an exaggeration.
 
Agreed. I'm glad you're not following the Champion Trader plan ... it was discussed in depth in this thread Champion Trader Commercial System and although it seems to have some reasonable principles the "champion" bit is an exaggeration.

"The trouble was that the stocks I was scanning never seemed to do what it said in the book."

This would make such a great epitaph . . .
 
Aye indeed, but hopefully not mine... ;) I haven't ended up using Champion Trader by the way but have taken what I thought were the best bits from several strategies. The problem is that with my level of knowledge who knows if it's workable? We'll see I suppose. I'm drafting something on that just now and will post later today.
 
I agree with dbpheonix great introduction.

How your experience to date reminds me of my early experiences, and perhaps also many others using this website. The amount of information available and the number of indicators that can be applied to a chart is mind blowing.

You have looked at stratagies and money management and I must say well done, the first helps the latter is in my view essential.

When it comes to a strategy though have you looked at a methodical strategy? Might I suggest you invest in a book called Channel Surfing. I was many years down the path before I encountered this book and how I wish I had read it at the start of my trading life.

I wish to make it clear that I have no commercial affiliation with the author Michael Parsons though I was a student of one of his advanced subjects and we do communicate from time to time on a pupil mentor basis.

good luck

Nut
PS
Well done with the rugby
 
Incidentally, you and Jason ought to get to know each other (Jay's Journal).
 
Thanks for the kind words so far!

Okay I've drafted the second section, which details my developing strategy, but I want to include screen-shots of chart setups and this is on another PC which I won't have access to until tomorrow, so in the very unlikely event that you're waiting with bated breath for the next installment :D I'm afraid you'll have to wait a little longer.

Nut - thanks for the tip - I ordered the book from Amazon today.

DBP - I've been reading Jay's journal. Wow! That's an impressive level of detail! Very interesting stuff. Way ahead of me.
 
Okay, this next bit is likely to be a bit tedious and long because I’m going to try to explain, with diagrams and text, the strategy I came up with. It can’t be helped though, because it’s pretty essential that I detail this, so please bear with me.

I was influenced by a number of websites – in particular I think Swing Trading Guide | Learn How to Trade Stocks Like a Pro! is useful. I also read several books, among them Mark Rivalland’s “On Swing Trading”, Van K Tharp’s “Trade Your Way To Financial Freedom” and Alexander Elder’s excellent “Trading For A Living” and they all seemed to stress the same thing – that an entry strategy is only a part of what you need. Far more important they said was to sort out your own psychology and to come up with a good money management strategy. Advice along the lines of “protect your equity – without it you can’t trade” were common to all approaches.

So this became a key part of my overall plan. Looking back at Champion Trader I’m pretty surprised that he advocates risking up to 25% of total equity on one trade! Obviously I was new to this game when I first read it and I just accepted that, and his growth predictions seemed amazing! But having read widely since, I think that this level of risk is positively suicidal! I decided that in order to allow me to sleep at night my strategy would risk an absolute maximum of 2% of equity on each trade. Once I had made that decision others fell into place.

For example this meant that I had to place reasonably tight stops. Taking advice from several sources I decided that I would start (on paper) with very tight stops indeed and then relax them gradually until I arrived at some sort of happy medium that worked (I’ll come back to the specifics shortly).

I then started casting around for some good entry signals. Champion Trader had the benefit of simplicity but after my early experiences paper trading it I felt I needed something more ‘definite’. I found a website (unfortunately I can’t remember which) that discussed Wilder’s ADX (Average Directional Index) and how when the +DI and –DI lines cross it can be used as a buy or sell signal (depending on which line is above). That sounded like a good solid signal so I thought I would incorporate it into my embryo strategy.

So I set up daily candles covering 3 or 4 months with a 50 day Simple Moving Average and then used Wilder’s ADX (Average Directional Index) with a 10 period setting to predict entry signals. Here are the conditions for a long entry.

• The 50 day SMA should be rising, and the price candles must be above the line.
• The +DI line needs to be crossing to above the –DI line OR to have fallen then bounced back off the –DI line. Here is an example chart showing this exact situation with the purple line showing the cross-over:

http://www.trade2win.com/boards/attachment.php?attachmentid=34388&stc=1&d=1205763015

• For short entry you just reverse everything. Here’s an example of a short-entry setup with the SMA50 falling and the purple line marking the cross-over:

http://www.trade2win.com/boards/attachment.php?attachmentid=34389&stc=1&d=1205763015

Once the initial conditions for a trade have been triggered I would then look at the candle on the day the lines cross – if it is an ‘inside’ day I look at the previous one etc. Whichever, this is the candle (let’s call it the ‘entry’ candle) I use to set up my exact entry position and stop. I decided, more or less randomly (for now – I need to start somewhere!), to place my stop-loss at 1% of total share price below (going long) or above (going short) the high/low of this candle. This percentage I see as a starting point only, to be adapted as I learn.

I also read that Wilder had recommended placing your buy order 3% above the high price (going long) of the ‘entry’ candle to avoid whipsaws. I tried that at first, but none of my trades were triggered. In my infinite wisdom I dropped it to 0.5% and got whipsawed out of several paper trades for showing initiative! So this figure still needs to be adjusted to find a happy medium – I thought I would try 2% for starters.

As well as these entry signals, I also felt that I needed an indicator to show me when stocks were actually trending and the strength of the trend. I had learned that the ADX line can show you that, and as I was already using the +DI and -DI indicator it was easy enough to add the ADX line. Basically (as I understand it) if this line is anywhere above 25, and especially if it’s climbing, this indicates a developing strong trend (though not the direction of the trend).

At the same time I read about Chick Goslin and his method of selection based on averages for three different 3 time period. The first is a 49 period SMA and as I already had a 50 period SMA on my chart I figured that was close enough. That’s his long-term indicator. The medium and short term indicators are based on MACD so I needed to add this to my chart (you can see how I was beginning to THINK now instead of just adding random indicators on a whim). So MACD went on with the recommended 3 & 10 settings for the DL and 16 for the SL. If you want to learn more about this I recommend having a look at this site in the first instance and buying Goslin’s book for more detail:

:: actio-et-reactio ::

Without repeating what was covered there, as I understand it, if these combined indicators score +2 or more it’s an indication (nothing more) that an up-trend might develop/continue. Anything less than 2 is inconclusive and best left alone. Likewise if the indicators score -2 or less it’s an indication that a down-trend might develop/continue.

So now I felt that I had something that looked at the reasonably long term, medium term and short term using Goslin’s criteria; an indicator of strength of trend with ADX, an indicator of an imminent opportunity with the crossing +DI and –DI; and exact placements for entry and exit based on the ‘entry’ candle. Rightly or wrongly I feel that I’m ready to start having a go (on paper of course) and at least I have a more or less workable plan that can be altered and adapted over the coming weeks/months.

Here’s an example of the final set-up:

http://www.trade2win.com/boards/attachment.php?attachmentid=34390&stc=1&d=1205763015

Next I needed to know when to take profits. I decided to keep this as simple as possible for now, so I’m going to set-up trailing stops using the previous day’s low (for long trades) or high (for short trades) and going 1% below/above in an attempt to avoid being stopped-out prematurely. I’ve just heard about the Elder Safezone stop method and it sounds promising too – I’m going to research it in the next few days.

For now I decided that I would apply this new strategy to FTSE100 shares and that I would check every share – paper trading. I have nothing to lose and everything to learn… I’m also aware that you can set up scans to search for potential setups, but firstly I don’t know how to do this yet, and secondly I think I’ll probably learn more doing it myself for now.

I’m going to use spread betting for the tax benefits and leverage (paper trading only for now). I will trade end of day data only and place entry orders and stop losses based on the ‘entry’ candle when the ADX lines cross or bounce off each other. For a long trade the ‘Goslin Score’ (just what I’m calling it) must be +2 or more, and for a short trade -2 or less.

Only time will tell if this strategy works – it may be crap for all I know (so be warned if you intend to copy it!) – but I see it as a starting point from which to develop.

Only one thing remained – all good sources that I’ve read recommend good record keeping as an essential part of the learning process, so I designed my own form which leads me step by step through the process of setting up a trade. As the strategy is adapted (hopefully with help from others on this forum), this form will change, but for now, in case you find it useful, here is my current recording form. I decided to use paper forms. One day no doubt I’ll transfer to an electronic system, but for now this will do.

http://www.trade2win.com/boards/attachment.php?attachmentid=34391&stc=1&d=1205763201

If anybody wants a copy of the word file for this form just pm me.

I’m going to keep a file of trades and each completed record will be accompanied by a copy of the chart on the day of entry, and another copy of the chart on day of exit. I’ve developed a very quick way to identify which were winning and which losing trades – I use either a green (for gain) or red (for loss) highlighter and put a big cross through the entire form.

I’d be very grateful for any comments on the above outlined strategy, especially ways in which to make it more robust or give more of an ‘edge’. Also, if anyone can tell me how to embed the thumbnails or originals in the text that would be useful. Thanks.

I think I'm going to take a couple of paracetamol and lie down in a darkened room for an hour or two now... :)
 

Attachments

  • Example 1.JPG
    Example 1.JPG
    48.3 KB · Views: 383
  • Example 2.JPG
    Example 2.JPG
    47.5 KB · Views: 378
  • Example 3.JPG
    Example 3.JPG
    54.5 KB · Views: 389
  • form.jpg
    form.jpg
    551.4 KB · Views: 379
me.

I’m going to keep a file of trades and each completed record will be accompanied by a copy of the chart on the day of entry, and another copy of the chart on day of exit. I’ve developed a very quick way to identify which were winning and which losing trades – I use either a green (for gain) or red (for loss) highlighter and put a big cross through the entire form.

I’d be very grateful for any comments on the above outlined strategy, especially ways in which to make it more robust or give more of an ‘edge’. Also, if anyone can tell me how to embed the thumbnails or originals in the text that would be useful. Thanks.

I think I'm going to take a couple of paracetamol and lie down in a darkened room for an hour or two now... :)

I like your idea of the proforma and paper chart of each trade - that is in fact what i do and it's been very successful in enabling me, nay forcing me, to concentrate on what's actually happening as opposed to what i'd like to happen. I found this so useful that I now print out a fresh proforma and updated chart for each day i'm in the trade - I then continually re-assess the situation and record my comments. i have a space for my forward plan, targets, mental stops and support resistance etc. I do this at eod in prep for the next day. Having done it on paper reinforces it mentally and it works a treat for me. Also interesting to go back and review past actions - amazing as you gain experience what you later "see" but missed at the time..

Your blog (oops! i mean journal) is excellent. Paracetemol? - nah, go straight to the Ibruprofen!
 
I’d be very grateful for any comments on the above outlined strategy, especially ways in which to make it more robust or give more of an ‘edge’. Also, if anyone can tell me how to embed the thumbnails or originals in the text that would be useful. Thanks.

Well, since you asked.

There's nothing inherently wrong with indicators. If you're able to develop a consistently profitable strategy with them, more power to you.

However, you should understand that all the indicators you're plotting on your charts are variations of the same thing, i.e., a means of determining trend. You can save yourself a lot of time by learning how to determine trend, then by determining what timeframe is most comfortable to you.

Most traders are much like the deaf who don't know how to read lips, or at least aren't very good at it. Rather than focus on the person speaking, they instead focus on whoever is doing the signing, glancing at the speaker only occasionally, or perhaps not at all. Rather than "hearing" for themselves what's being said, they're relying on somebody -- or something -- else to tell them what's being said. Even if they can rely on the interpreter, they are still removed from what is being interpreted.

Therefore, I suggest you learn to read lips yourself.

Wow DBP! What an interesting and profound post! Can I give you another metaphor, to see if I've understood what you're trying to say. Saturday was the start of the trout season here. I set up my rod reel and fly-line, tied a leader to the line, tied a single fly to that and set out. Within 15 minutes I had caught a lovely 1lb 8oz trout. What I just don't understand is these guys who go fishing with everything but the kitchen sink - it seems they just can't catch fish without a plethora of gadgets. I keep telling them they just don't need it, but it's like a psychological crutch and they can't let go.

And now here I am doing it myself! I will think on your wise words... Sincerely I thank you!
 
Wow DBP! What an interesting and profound post! Can I give you another metaphor, to see if I've understood what you're trying to say. Saturday was the start of the trout season here. I set up my rod reel and fly-line, tied a leader to the line, tied a single fly to that and set out. Within 15 minutes I had caught a lovely 1lb 8oz trout. What I just don't understand is these guys who go fishing with everything but the kitchen sink - it seems they just can't catch fish without a plethora of gadgets. I keep telling them they just don't need it, but it's like a psychological crutch and they can't let go.

Well, perhaps. The metaphor would be more accurate if for example you had studied the stream to learn whether those areas in sunlight provided any more success than those in shadow, or the still pools outside the current were more desirable than the current itself. You'd then conclude that knowing where and when to fish was more important than the gear you used.
 
Hey Gododdin,

Great start to your journal. I in fact agree with what Db is saying but on another level, I think you need to figure it out for yourself. Sometimes it seems as though being taught to trade is impossible, you can only learn it. Having a system in place to start your trading is a good way to preserve capital. Right now the focus would be staying in the game long enough to find what Db is saying.

If you picture it as a professional sport, say basketball. If you're new to basketball, you first need to learn how to dribble, shoot, pass etc. However once you have learnt those skills you then have your eyes opened up to reading your opponent so you can dribble around them, pass without them realizing you did so and shooting when they are wrong footed. The latter skills only come with time playing the game. You could imagine how hard it would be to focus on the opponent when you are focusing on the dribbling, passing and shooting at the same time.

If your new plan helps you learn discipline, money management, risk management and gives you a chance to watch the market, I think you have yourself a good start. There is a reason it took most traders I know, a few years to become consistently profitable. Just like it takes a basketball player a few years to become great.

Keep up the great work.
 
Hi Jason - thanks for that! Funnily enough I was thinking along the exact same lines myself last night. Continuing the fishing analogy, even if I knew from careful observation that there was a big fish under those trees over there where the water calms at the side of the ripple (sorry, got carried away there!), I'd still have no chance of catching it if I couldn't tie the knots and cast the fly delicately under the branches without making a splash!

I'm aware that I need to walk first, run later.

Even given the state of the markets just now I'm going to try out the system (paper trading only) to see how I get on (unless any of you more experienced guys recommend otherwise). I don't think I have anything to lose...

I'll post my results here - it won't be for a day or two however - work's getting in the way
 
Stuck in bed for a couple of days (at least) with a slipped disk, which has given me an opportunity to do some quiet contemplation...

I’ve been doing some thinking about DBP’s ‘signing’ analogy. I think what you’re saying is that any indicator is only an interpreter of the price action and therefore why look at them and get a second-hand interpretation when it’s just as easy (with practice, I guess), and better, to look at the prices themselves and come to your own conclusions.

The whole idea of not using indicators (or at least reducing their use to a minimum) appeals to me a lot – less clutter on screen probably allows you to see what’s really happening. Also, following the interpreter metaphor through, you could spend all your time looking at the indicators and miss what’s staring you in the face with the price action. Another way to put it might be – why read a book in translation – better by far to put in the effort, learn the language, and read the original!

So I thought it would be a good exercise for me to go right back to basics and ask a few fundamental questions:

Why do we use indicators at all? Seems to me that the only reason to use indicators is to try to predict what will happen next. If an indicator can’t predict, or at least give an indication of, what will happen next at the hard right edge of the chart, it really isn’t worth a damn, is it? An indicator that’s good at telling you what happened last week, yesterday or even five minutes ago is surely useless?

So for now, let’s get rid of indicators altogether and just look at price. What is it that we want to know from the price? Basically (and please correct me if I’m wrong) we want to know about:

Support

Resistance

Trend

Volume

1. We want to know if the price is heading for a point of resistance or a point of support, and then whether it is going to break through R/S or rebound off it. We also need to consider that support frequently becomes resistance and vice versa.

2. We want to know if the price is trending (higher highs and higher lows, or lower highs and lower lows), whether the trend is likely to continue and how long for.

3. My current level of understanding is that volume can be useful in determining the strength of a trend or lack of it but I admit that I’m a bit vague on that just now.

And why do we want to know about support/resistance, trend and volume? Surely for the same reason we use indicators – so that we can have some idea what the price will do next - because that is the only way a trader will profit, isn’t it? And the only reason that we can predict at all, and that prices are not just entirely random and chaotic is, as we read in Alexander Elder’s ‘Trading for a Living’ because the behaviour of the crowd (unlike the behaviour of individuals) is, at least to a certain extent, primitive and predictable, based on fear and greed! And this is the main reason for eliminating emotion from our trades by having a plan and sticking to it rigorously – when we trade based on emotion we become one of the crowd.

Here, again from Trading for a Living, is the best explanation I’ve found so far about why trends develop:

“When the trend is up, bulls feel optimistic and don’t mind paying a little extra. They buy high because they expect prices to rise even higher. Bears feel tense in an uptrend, and they agree to sell only at a higher price. When greedy and optimistic bulls meet fearful and defensive bears the market rallies – the stronger their feeling the sharper the rally. The rally ends only when many bulls lose their enthusiasm. When prices slide, bears feel optimistic and do not quibble about selling short at lower prices. Bulls are fearful and agree to buy only at a discount. As long as bears feel like winners they continue to sell at lower prices and the downtrend continues. It ends when bears start feeling cautious and refuse to sell at lower prices.”

It seems to me that what Elder is describing here are not just trends, but also the whole principle of support and resistance, by which I begin to realise that support, resistance and trends are really the same thing! Surely it’s all a question of the timescale you are using? What is the difference between resistance and the top of an uptrend, and support and the bottom of a downtrend?

What seems glaringly obvious is that you should buy as close as possible to the bottom of a downtrend or point of resistance (which amounts to the same thing?), and sell as close as possible to the top of an uptrend/point of support. And that’s what makes it so important to be able to identify when they occur.

But I guess it’s all about the balance of probability, and perhaps the best we can do is act on the information before us, backed up with rigorous risk & money management. I get the feeling that there is a strong probability that indicators, in providing the illusion of certainty, can sometimes unwittingly lead us to make bad decisions and to take unacceptable risks if we blindly follow them.
 
What seems glaringly obvious is that you should buy as close as possible to the bottom of a downtrend or point of resistance support??? (which amounts to the same thing?), and sell as close as possible to the top of an uptrend/point of support resistance??? And that’s what makes it so important to be able to identify when they occur.
Hi goddodin,
I think you might have got your S&R **** about face? Either that, or I've got the wrong end of the stick!
But I guess it’s all about the balance of probability, and perhaps the best we can do is act on the information before us, backed up with rigorous risk & money management. I get the feeling that there is a strong probability that indicators, in providing the illusion of certainty, can sometimes unwittingly lead us to make bad decisions and to take unacceptable risks if we blindly follow them.
As I think you've gathered by now, when it comes to S/R, price, volume, supply and demand, dbp is T2W's 'Trader in Residence'. For my money, he deserves all the praise he gets because he writes brilliantly, explaining concepts very clearly and simply. However, in you, I think he may have met his match! You're an excellent wordsmith; the paragraph quoted sums up perfectly - and very eloquently - why 'naked' traders or 'darksiders' - call them what you will - choose to dispense with indicators. Your journal is a joy to read, keep up the good work!
I hope your back improves soon.
Tim.
 
Thanks timsk - you're right, I got that completely the wrong way round - must have been the morphine I'm taking for the pain making me woozy! :) Apologies if I caused confusion.

Thanks for the kind words, but I think it will be a long, long time before I'm in the same league as dbp! I like the idea of being a 'darksider' though - not a phrase I've heard before but I think I want to be one!
 
Hey Gododdin,

Although I said you need to find your own way to the idea of price action and how it works, I think you may have just described your path to it. It's good to see you have discovered what I believe many traders never do. They are too caught up in finding indicators to tell them whats happening next yet whilst doing so they never really understand the market.

And the only reason that we can predict at all, and that prices are not just entirely random and chaotic is, as we read in Alexander Elder’s ‘Trading for a Living’ because the behaviour of the crowd (unlike the behaviour of individuals) is, at least to a certain extent, primitive and predictable, based on fear and greed! And this is the main reason for eliminating emotion from our trades by having a plan and sticking to it rigorously – when we trade based on emotion we become one of the crowd.

You're right that price is not random as many traders preach. In my opinion that's what many preach because they don't understand the psychology behind the market. However the idea of eliminating emotion from your trading is not a great idea, your emotion tells you a lot about the market. That is one of the reasons why I said you need to dwell in the markets. Your emotions can actually tell you when to trade against the market.

Say for instance a strong trend is going on for quite some time and you begin to feel as though you should get on because it looks like it will go forever and you are missing out by not being on it, you can bet there are stacks of other traders out there thinking the exact same thing. So that is the point you understand your emotions of greed kicking in and begin looking for the turnaround. It is when everyone becomes bullish that the market runs out of sellers just as you described.

Your emotions are not your enemy as many people say about trading. It is how you ACT upon your emotions that can be your enemy. Say you feel angry because someone has ripped you off, you feeling angry isn't a problem, in fact it is probably a good source of information that you need to act in some way. However if you act out in violence, you are sure to be worse off. However if your anger is used pro actively and kicks your butt into gear to assess the situation and write a letter or see a solicitor, you will likely see your money again. See how the emotion wasn't the problem, it was the action that could be the problem. The emotion in fact was a source of information telling you an injustice was done.

Actually there are scientific discoveries in neuroscience that has found people who are unable to feel emotions due to problems with their amygdala section of the brain, are unable to make decisions. In trading this means if you remove emotion, you also remove the ability to act. You no longer feel strongly about going long or short in the market and you have equal reasons to do both.

You need to remove the impulsive actions that emotions give you instead of removing the emotions. So instead of feeling fear and getting out or in a trade immediately, you need to recognize the fear and assess why it's there. Without too much thinking about self and whilst staying focused on the market.
 
Top