Spreadbetting Journal – Trend Strategy

isatrader

Senior member
Messages
2,963
Likes
134
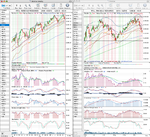
This journal will cover my active trading within my spreadbetting account. The timeframe used is mainly daily charts and weekly charts, with 4 hour charts for entries. Products traded will be Currencies, S&P 500, Gold and Stocks.

The aim of this strategy is to only play trades with a high probability of success. The indicator rules were chosen to help filter out the volatile sideways periods and to identify a developing trend, which I can hopefully then ride up until being stopped out using a Chandelier Exit stop loss.

I backtested this strategy using just the first four main criteria on FTSE stocks, Commodities, Indexes and a range of Currencies. The top performers were those that had fairly consistent volatility during uptrends and tended to trend the most. This tended to be the major indexes, currencies and gold. So I will focus on trading mainly the S&P 500, Gold and a few currency pairs that I have the risk tolerance in my account for with this strategy.

Daily Buy Signal On Criteria

Long Entry

All of the following MUST be fulfilled to consider a long entry:

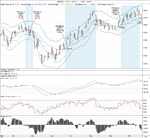
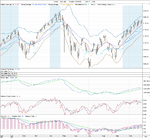
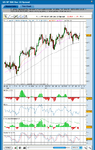
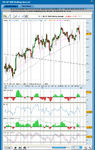
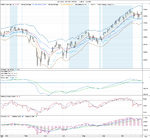
1. Close above the Chandelier Exit (settings: High Period: 22; ATR Period: 22; Time Period: 3)
2. Rising 22 Day EMA
3. Close above Ichimoku Kinko Hyo Senkou Span A Calculation
4. Close above Ichimoku Kinko Hyo Senkou Span B Calculation

Once these criteria have been fulfilled I need to confirm the buy signal using my other favourite indicators.

Daily Indicators
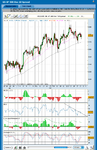
1. Force Index – 10 day cumulative summation line must be above it’s 22 day moving average line.
2. RSI – The 14 day line must be above it’s 9 day moving average line.
3. rRelative EMA crossover – The 22 Day EMA must be above the 52 Day EMA.
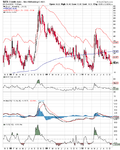
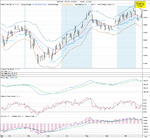
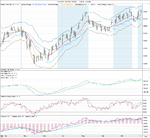
Weekly Indicators
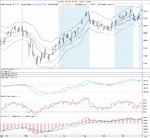
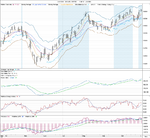
1. rRelative 50 must be in an uptrend. i.e a weekly rRelative EMA must have had a crossover to the upside.
2. Force Index – 13 week force index must be above it’s 9 week simple moving average.
3. RSI – must be above it’s 9 week simple moving average.

Short Entry

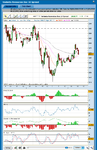
This system is mainly suited to uptrends due to their lower volatility as I mentioned before. But if I want to short, the reverse of these settings MUST be in place to consider a short entry. However, from testing it is clear that shorting using this system only works well when trading currencies. But it is not as successful as trading long only, and gives many more false signals.

These are the rules for the system that I aim to follow. I will use other discretionary analysis such as economic data, news events and general market trends as well to help filter out the false signals.

Next Step

If confirmed – Look for entry point
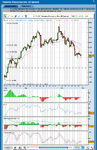
1. Drop down to the 4 hour chart to look for an entry point.
2. Aim to buy in the daily value zone between the 11 Day EMA and the 22 Day EMA.
3. Don’t buy until the 22 Bar EMA crosses above the 50 Bar EMA on the 4 hour chart after a pullback to value.

Stop Loss
1. Initial placement – Safezone Stop setting of 2x average downside penetration. If however, this is above entry point, then check the Average True Range (ATR) and place the stoploss a reasonable distance below based it’s daily range and my acceptable risk per trade. If the risk is greater than 2% of my account value then the trade is not possible. Ideally for currencies the risk should only be 0.5% of my account.
2. Chandelier Exit – once it rises above the initial stop loss update daily to lock in profit.

Elders Money Management Rules

Risk per trade – 2% rule
Trade sizes: Small (0.5% risk), Medium (1% risk), Large (2% risk).
1. Is the trades risk 2% or less?
2. 6% Rule – Stop trading for the rest of the month after hitting a 6% limit of drawdown plus open risk.

Exit Rules
1. Chandelier Exit – automatic stop loss (settings: High Period: 22; ATR Period: 22; Time Period: 3)
2. Safezone Stop (setting of 2.5x average downside penetration) – if the price accelerates away from the Chandelier stop loss and indicators are diverging, then use discretionary safezone stop. Close position manually if it closes below the safezone stop.

It is a fairly simple system at it’s core – basically identify an uptrend, buy at value and follow the uptrend until stopped out. However, it will require a number of discretionary decisions once the buy signal is activated to decide whether the signal is valid or not to help filter out the false signals.

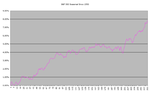
My starting account size is £4024.61, so initial maximum stoploss position for 2% risk is £80.49 per trade.

I will aim to trade well below this to begin with, so as to give me time to test the system in real life with only minimal risk to my overall account. As I know spreads can be widened by unscrupulous brokers to stop you out of a trade. I’m hoping my spreadbetting firm won’t do this, but I’d like to be prepared incase they do.

Ok, lets see how I go. I will update the journal once I have my first potential trade in the coming days.

isatrader :) View attachment 94376
 

Attachments

  • System_Example_22-10-10.png
    System_Example_22-10-10.png
    66.6 KB · Views: 1,209
The trend strategy isn’t the only strategy I will be using to trade in my spreadbetting account, as I like to trade stocks and commodities as well using more discretionary methods. So I will be showing my trades for these as well. For example, I’m currently considering opening a position on the VIX to add some protection to my long term ISA portfolio, but I have a bit more research to do yet before placing it.

I aim to update the journal regularly when I take new trades and will show my trading spreadsheet and profit and loss chart every month, so I have a record of my progress.

isatrader
 
VOLATILITY S&P 500 entry

Ok, after looking through the VIX charts it looks like it’s near a good support long term support around $17.50 which has held for the last few years. Long term price has gone as low as $10.42 in Jan 07, but that was after a few years of the market rallying.

Current price is at $19.41 as I write, so this looks like a good point to get in with limited downside risk, as I’m nervous about the FED disappointing the market next week with QE2. The last major spike up in the VIX was late April and it reached around $45. So some good potential upside if the market gets spooked.

Spreadbetting prices are a bit different than the official prices so I’ve bought the Nov spread which has a 0.5 spread.

Trade
Volatility Index Nov 10
Stake: £10
Entry price: 21.1

I’ve attached the $VIX chart from stockcharts.com below for reference.

isatrader
 

Attachments

  • $VIX_25-10-10.png
    $VIX_25-10-10.png
    31.4 KB · Views: 320
Am still waiting for a good entry signal. The buy signal is still on to go long on the S&P 500, but it has been active for a while, so I’m not willing to get in at the moment as I don’t want to chase it.

I have been watching the sell signal on GBP/EUR, which turned off after it went through it’s chandelier stop at 1.1444, so that would have been a really good signal as the entry point was 1.1946 – so a 502 point move there. Hopefully now I’m live trading, there will be some more of those in the future to try and get into.

So, as there’s no good signals on the currency pairs I’m watching; I’ve been working on refining the trend strategy a bit today, as I noticed a lot of the buy signals that stopped out for a loss, tended to rise for a few days first before turning down. So I’ve been experimenting with setting a profit stop as well as a loss stop at different settings to see what generated the best results.

For example the best settings for me on the GBP/USD using data since 01/01/2000 came out as:

Loss stop: 175pts
Profit stop: 350pt

Total: +4157pts
89 trades in total – 40 winners and 49 losers.
= 44.94%

It doesn’t look particularly great, but is an average gain of +46pts per trade on the GBP/USD with these settings, which seems respectable to me. So I’m going to try using these settings when I get a new signal that looks promising on GBP/USD.

My software is fairly basic for testing. I use ProTA Gold and it doesn’t give much option on entries and exits. Only the close or open of the day, so if anyone out there is really good at programming and tests out the strategy then I’d be interested to see the results.
 
Randgold Resources Order

Limit order placed on the Dec 10 spread of Randgold Resources

Date: 27/10/10
Qty: 0.50
Price: 5812

Stop: 5650
Limit: 6500

Account Risk: 2.01%
Potential Gain: 8.55%
Risk Ratio: 4.25

Order reason
The gold market is at a seasonal low point as shown by the excellent attached charts from zealllc.com. Randgold has had a number of good rallies when it has approached the 200 day moving average over the last few years. So looks a good entry point. Technicals have all pulled back and don’t look particularly promising, but this order is a seasonal buy, so I am more concerned with the 200 day moving average.
Randgold is a bit big for my little account, so I’ve used my maximum risk on a trade and placed the order a few percent below the current price to give me some room. Lets see if it gets filled.

isatrader
 

Attachments

  • HUI Seasonal Chart.gif
    HUI Seasonal Chart.gif
    50.6 KB · Views: 365
  • Gold 9 year seasonal.gif
    Gold 9 year seasonal.gif
    48.4 KB · Views: 416
  • RRS_Chart_27-10-10.png
    RRS_Chart_27-10-10.png
    139.1 KB · Views: 476
Randgold Resources Long Entry

The gold price seemed to be moving a bit fast to the downside this afternoon so I moved my limit order down a few times, especially after the crude inventories data hit as the gold price took a big down leg at that point. I decided to manage my entry manually using the 2 min and 30 min chart for my entry point.

Trade Details
Randgold Resources Dec 10 Spread
Entry Price: 5779.11
Qty: 0.5
Spread: 24pts

Stop: 5618
Limit: 6500

Account Risk: 2%
Potential Profit: 8.96%
Risk Ratio: 4.47

Entry Grade: 90%

Below is the end of day chart for RRS.
 

Attachments

  • Randgold_Chart-27-10-10.png
    Randgold_Chart-27-10-10.png
    139 KB · Views: 283
S&P 500 Long Entry

I’ve opened a very small position on the S&P 500 Dec 10 Spread with the intention of scaling in on future pullbacks to bring my position up to 1% risk.

Entry Price: 1171.9
Qty: 0.5
Spread: 0.6pts

Stop: 1147
Limit: 1220

Account Risk: 0.31%
Potential Account Profit: 0.6%
Risk Ratio: 1.93

I’ve attached the S&P 500 historical charts I created as well as the 4 hour chart so you can see why I think it’s a good time to get in.

isatrader
 

Attachments

  • SP500_entry_27-10-10.png
    SP500_entry_27-10-10.png
    30.3 KB · Views: 379
  • SP500-BearHistorical_22-10-10.png
    SP500-BearHistorical_22-10-10.png
    26.6 KB · Views: 1,220
  • SP500-Historical_27-10-10.png
    SP500-Historical_27-10-10.png
    24.8 KB · Views: 1,397
Hedging strategy

I’ve been thinking a fair bit about protecting my account and the benefits vs drawbacks of hedging. But I think I have come up with a reasonable solution which won’t cost me too much to implement.

My plan is to keep a long term position in the VIX and possibly increase my position when the markets has had a big rally for a few months or so and volatility has fallen to previous resistance points. To do it I will need to auto-rollover my current position each month, which I believe costs half the spread (Spread is 10). So £5 a month cost at £10 per point. Which means a cost of £60 a year in costs. It can also fall in value and the previous long term low is around $10 on the $VIX. So I got in around $19, so that’s another £90 it could fall. So my total risk of holding it for a year would be £150.

I’m not allowing myself to continue trading in a month if I lose more than 6% of my account – which is currently £241. So in theory if the market crashes and I’m stopped out of all my open trades, then the rise in the VIX will recoup most or more than the loses. I’m basing this on that I got in at around the $19 price and previous corrections have taken the VIX above $45, which would mean a £260 profit. So that would cover my losses.

What I’m not sure of is whether I should include the VIX position in monthly risk calculation as at £150 total risk it would take up 3.7% of my monthly risk allowance leaving me only 2.3% to play with or whether it should be separate as it is a hedge. I think maybe I will include part of it to start with and bring down my monthly risk limit on other positions to 4% max risk a month and see how it goes,
 
S&P 500 Long Entry Scale in

I’ve opened another very small position on the S&P 500 Dec 10 Spread which brings my position risk up to 0.7%.

Entry Price: 1178.4
Qty: 0.5
Spread: 0.6pts

Stop: 1147
Limit: 1220

Account Risk: 0.39%
Potential Account Profit: 0.52%
Risk Ratio: 1.32

The risk ratio is very small at the moment, but I’m using a safezone stoploss so I will be moving that up at the close today, which will start to bring the risk ratio up. The buy signal is still on, as shown in the attached chart and I think it has a bit room to run yet. I’ve set my limit order near the previous high, but I might switch to a chandelier stoploss to track the move if it gains some momentum over the coming days.
 

Attachments

  • SP500_signal_28-10-10.png
    SP500_signal_28-10-10.png
    74.2 KB · Views: 665
  • SP500_entry_28-10-10.png
    SP500_entry_28-10-10.png
    30.8 KB · Views: 323
GBP/USD Signal On

Looks like I’ve got a possible entry on GBP/USD. The buy signal was triggered at today’s close. So now I need to confirm it’s a valid signal and then watch for the pullback to value in the coming days for decent entry point. I think there’s a good chance I’ll get one as there should be some resistance around the 1.60 level again.

The 11 Day EMA is currently at 1.5808, so that is my initial entry target with the chandelier stop currently at 1.5724 – so an 84 point margin of entry.

I will watch closely on the 4 hour chart and the 5 min chart to see if it finds a base and turns up. As if it breaches 1.5724 the signal will be invalidated. If however, it does base in my buy zone then I will go long.

Patience is needed for this I think to see if it has potential to be good entry point.
 

Attachments

  • GBPUSD_signal_28-10-10.png
    GBPUSD_signal_28-10-10.png
    66.5 KB · Views: 273
GBP/USD Entry zone

Based on the overnight price movement of GBP/USD, the 11 Day EMA has moved to 1.5826 and the Chandelier exit to 1.5738, so that is now my value zone where I will look for an entry if the price action looks promising after the GDP data this afternoon.
 
GBP/USD Entry zone

Doesn’t look like I’m going to get an entry point today. As the US GDP data was good and Pound is rallying now. It got close though, was only 37pts from my value zone earlier, but I will get another chance to get in next week I think.
 
Re: S&P 500 Long Entry Scale in

I’ve opened another very small position on the S&P 500 Dec 10 Spread which brings my position risk up to 0.7%.

Entry Price: 1178.4
Qty: 0.5
Spread: 0.6pts

Stop: 1147
Limit: 1220

Account Risk: 0.39%
Potential Account Profit: 0.52%
Risk Ratio: 1.32

The risk ratio is very small at the moment, but I’m using a safezone stoploss so I will be moving that up at the close today, which will start to bring the risk ratio up. The buy signal is still on, as shown in the attached chart and I think it has a bit room to run yet. I’ve set my limit order near the previous high, but I might switch to a chandelier stoploss to track the move if it gains some momentum over the coming days.

I decided to close the scale in position I placed in the S&P 500 yesterday as the market looks like it could be stalling today. So I closed for a very small profit with the aim of getting back in early next week at better value.

I have also tightened up my stop loss on my previous S&P 500 position so that it will close at breakeven if the market sells off. So risk is now zero on this trade.

Closing trade
Entry Price: 1178.4
Exit Price: 1181.30
Qty: 0.5 per point
Points: 2.9
P/L: £1.45

It looks like I’m going to finish about 1% up for the week. But I will post my trading spreadsheet over the weekend and review the open trades for next week, what I need to watch out for and my plan for getting into GBP/USD on a pullback to value.
 

Attachments

  • SP500_exit_29-10-10.png
    SP500_exit_29-10-10.png
    30.4 KB · Views: 253
Trading Review – October

Attached is a screen shot of my trading spreadsheet, which I use to list my trades, calculate risk and potential profits. I also like to grade my trades based on how much of the daily Keltner Channel I manage to capture. I use the following grades:

A+ 40% and above
A 30-40%
B 20-30%
C 10-20%
C- 0-10%
D Below 0%
E Below -10%
F Below -20%
G Below -30%

It turned out to be a good week for my new account. All trades are currently in profit, giving me a 1.02% gain for the account. I’ve tightened up my stop losses on Randgold Resources and moved the S&P 500 stop to breakeven. So my risk is now back down to 0.39%.

I intend to re-balance my risk at month end each month. So I have calculated the new account size and adjusted the maximum sizes I’m allowed to trade in November.

November Account Start: £4065.49
Maximum Account Risk (6%): £243.93
Maximum Single Trade Risk (2%): £81.31

I’ll be watching the market closely this week as is going to be a very important week with the mid-term elections Tuesday, FED announcement Wednesday and Nonfarm Payrolls Friday. Think there could be a good chance that traders sell the news, so hence the tightening of my stoplosses. But it could go either way so will be watching with interest for any trading opportunities.
 

Attachments

  • Trades_spreadsheet_29-10-10.png
    Trades_spreadsheet_29-10-10.png
    24 KB · Views: 256
GBP/USD Entry zone

GBP/USD is getting closer to my entry zone. The weekend minor moves and todays action so far have brought up the 11 Day EMA to 1.5930. So my new target entry zone is between 1.5930 and the 1.5736 chandelier stop loss.

This is almost a 200 points zone, so I’ll be looking to get in at the lower end of the scale to keep my risk below 2%. So now I’ll be watching the intra-day charts to look for good entry point if it pulls back to value.
 

Attachments

  • GBPUSD_signal_1-11-10.png
    GBPUSD_signal_1-11-10.png
    65.5 KB · Views: 267
S&P 500 Long Exit

I exited my first position in the S&P 500 tonight on the pullback to value on the 4 hour chart after hours.

Closing trade
Entry Price: 1171.9
Exit Price: 1182.10
Qty: 0.5 per point
Points: 10.2
P/L: £5.10

Trade Grade: C

A very minor profit, but the trade got a grade C, so I’m fairly pleased as a C grade or better is what I aim for. The aim with this trade was to build the position size on the pullbacks to value, but today's pullback to near the 100 Bar EMA on the 4 hour chart looked stronger than the previous ones, so I was a bit more uncertain about the position; and with the election tomorrow and data this week I’ve decided to step aside for the moment. But will probably be back in later in the week once I have a bit more clarity from the data.
 

Attachments

  • SP500_exit_1-11-10.png
    SP500_exit_1-11-10.png
    30.9 KB · Views: 199
GBP/USD Entry zone update

Indecisive day for the GBP/USD. Traded in a fairly small range and only made it about half way towards my target entry point. But signal is still on and most of the false signals failed within a few days, so this one looks good so far.

New target entry zone
11 Day EMA: 1.5948
50 Day EMA: 1.5805
Chandelier Exit: 1.5746

The 14 Day ATR is 111pts, so there could be a chance it reaches my target zone today if it pulls back.
 

Attachments

  • GBPUSD_signal2_1-11-10.png
    GBPUSD_signal2_1-11-10.png
    65.5 KB · Views: 156
AUD/USD Signal On

I have another signal on now to watch for an entry point, as the AUD/USD came on tonight. It’s very close to the value zone but one of the indicator criteria isn’t there yet as the Force Index 10 day summation line is still below the 22 day moving average. My discretionary rules to help validate the signal are that I don’t go long until there’s a positive volume crossover on force index, so this is one to watch at the moment – even though it’s tempting. But I think that parity with the dollar is a big headwind still and I’d want to see a close above that before considering going long as well as my signal confirmation.
 

Attachments

  • AUDUSD_signal_1-11-10.png
    AUDUSD_signal_1-11-10.png
    62.1 KB · Views: 187
Vedanta Entry

I’ve opened a position on the Vedanta Dec 10 Spread as it looks to me like a swing bottom is forming.

Entry Price: 2075.98
Qty: 0.5
Spread: 15.4pts

Stop: 2029
Limit: 2600

Account Risk: 0.58%
Potential Account Profit: 6.44%
Risk Ratio: 11.15

I hold this in my ISA portfolio as a medium term holding and has dropped around 10% from a recent high. So I’m hoping it will be a good swing trade. I’ve got a tight stop, so the risk is low. But could get stopped out quickly on this one if it breaks the recent low.
 

Attachments

  • Vedanta_entry_4hr_2-11-10.png
    Vedanta_entry_4hr_2-11-10.png
    30.2 KB · Views: 171
  • Vedanta_entry_5min_2-11-10.png
    Vedanta_entry_5min_2-11-10.png
    29.6 KB · Views: 177
GBP/USD Entry zone update

GBP/USD had a fairly good try at moving down early in the day and got just inside my trading zone, but it wasn’t far enough for me as I was looking for a price nearer the 50 Day EMA, so no entry today. However, the EMAs are moving higher, so the new buy zone for me is now:

New target entry zone
11 Day EMA: 1.5961
50 Day EMA: 1.5907
Chandelier Exit: 1.5753

The 50 Day EMA is almost in reach of the ATR range now, so I could get an entry on this tomorrow (Wednesday).
 

Attachments

  • GBPUSD_signal_2-11-10.png
    GBPUSD_signal_2-11-10.png
    65.3 KB · Views: 180
Top