Here's something which might be interesting enough to add into your thinking. I was skimming (no pun intended) through a couple of books I read when I was first getting into trading and rediscovered the Guppy MMA. I have never used this as a trading method but rather as an indication of where we are and where we might be going.
The essence of it is that you chart a short term group (3, 5, 8, 10, 12 and 15)and longer term group (30, 35, 40, 45, 50 and 60) of EMAs and observe how they interact. The key features are:
1) When the two groups converge and crossover, there is agreement about valuations between short and longer term players and a major turning point is signalled.
2) As a trend develops, the two groups begin to separate away from each other. The MAs within each group also begin to separate.
3) The distance between the two groups as at its maximum when the trend reaches the extreme.
4) The gap between the MAs in each group is at its maximum when the trend reaches the extreme.
5) The MAs turn and begin to narrow when there is a trend change.
6) During setbacks against the prevailing longer term trend, the short term MAs pierce the well spread longer term group. These are false trend breaks and are potentially favourable entry points.
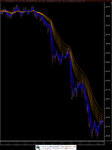
The attached chart is the S&P500 daily over the last year with the short term EMAs in blue and longer term group in orange. The price candles are there in grey and red too but they are not important in this technique. The interpretation is that we are at an infrequent moment in time when there is general agreement about prices between short and longer term players. We know that what follows can be a powerful implusive move and a new trend will emerge.
It works in all time frames by the way and can be very interesting intraday.
The usual disclaimer - I post this only as interesting intelectual stimulation and NOT as the basis for taking a position in the market.
The essence of it is that you chart a short term group (3, 5, 8, 10, 12 and 15)and longer term group (30, 35, 40, 45, 50 and 60) of EMAs and observe how they interact. The key features are:
1) When the two groups converge and crossover, there is agreement about valuations between short and longer term players and a major turning point is signalled.
2) As a trend develops, the two groups begin to separate away from each other. The MAs within each group also begin to separate.
3) The distance between the two groups as at its maximum when the trend reaches the extreme.
4) The gap between the MAs in each group is at its maximum when the trend reaches the extreme.
5) The MAs turn and begin to narrow when there is a trend change.
6) During setbacks against the prevailing longer term trend, the short term MAs pierce the well spread longer term group. These are false trend breaks and are potentially favourable entry points.
The attached chart is the S&P500 daily over the last year with the short term EMAs in blue and longer term group in orange. The price candles are there in grey and red too but they are not important in this technique. The interpretation is that we are at an infrequent moment in time when there is general agreement about prices between short and longer term players. We know that what follows can be a powerful implusive move and a new trend will emerge.
It works in all time frames by the way and can be very interesting intraday.
The usual disclaimer - I post this only as interesting intelectual stimulation and NOT as the basis for taking a position in the market.