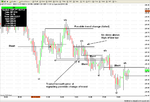
One more open question. Would you class this as a 3 or a six bar retracement. I see it as 3 bars.
I'm not sure you will get many replies on this.
If anyone is interested they will probably examine in great detail and come up with an answer, ....its a 5 bar retracement!! Or some other labelling system.
What I wonder is why are you so keen to give this bit of price action a label???
Perhaps the questions that you should be asking are:-
Is the price going up or down.....
If thats established, where can I enter with very low risk to capital....??
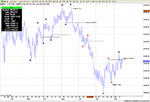
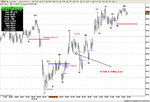
Where your big arrow points…..that green bar is the highest of the series of subsequent lower bars…that’s all you need to know:smart:
The probability is that a retracement will occur(a lot of newbies will know this after the event) . Put an order to open short after the formation of Bar 5 the stop can be a tick above bar 1 ,,,,and in my opinion the open within 5 points….therefore if the price heads north you have a tight stop. If it goes as predicted then a good win ratio.
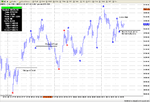
You will notice that the whole scenario repeats its self in the bottom right hand corner..there is your exit and a new entry, long.
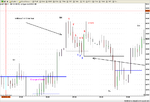
As far as the other chart goes……More labels….what is the point…..it certainly causes procrastination!
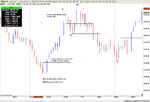
Up to 18570, you have a series of SLs (as labelled)
🙂
Clearly the price is going up.
So long it is.
At 18570……to the left of “Is this a swing low” (I would not know by the way)….You will see a double bottom…..You would need to be a bit brave but not that much, to enter a long the same way as mentioned above. Again the most you could lose is say 5 pips and some spread.
I hope that helps.