Dow Intraday trades...

ChartMan

Legendary member
Messages
5,580
Likes
47
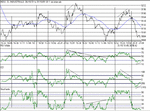
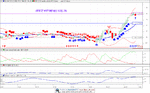
Chart attached is to stimulate further analysis. It shows the correlation of RSI, CCI, 100MA, stochastics and the various potential entry and exit points. Notice also some of the divergences....
A basic criteria for long entry is RSI>50 and CCI>0; Short entry RSI<50 and CCI<0. If you read the TA books, they suggest CCI values of +/- 100 as entries for long/short. These I consider "safe" values and maybe +/- 50 would be a little more realisticly safe for the dow.
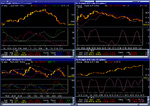
Test and refine your techniques on paper and see how you get on and remember that with CMC, the bid/offer typically moves ahead/behind by 10 points on strong moves, giving a minimum "win" move required of at least 30 points.
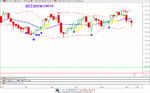
 

Attachments

  • 311001.gif
    311001.gif
    21.2 KB · Views: 1,006
COMPATIBILITY

These indicators are excellent in defining the next movement intra-day but they are not compatible in terms of acceleration.For example CCI is far far too fast and MA is far far too slow with RSI to be some where in between.CCI is a mean reverting signal generator which inherently swings too quick between OB/OS levels resulting in many whipsaws wrecking the traders confidence times and times again. I suggest CCI indicators to be harmonised using a regressed MA up to around 40% to slow down acceleration, and RSI wilder to be changed to RSI(close) and to be applied in various time frames (Multi time frame). I also feel a SAR indicator to be include in a single time frame as A STOP LOSS level (Not as an entry requirement) with ADX, + DI, - DI to support these levels.

The whole set up takes a few minute and analysis a few seconds only. This is a practical and easy set up which can be applied on most professional platform ( try real tick or www.ird.com). You can not have this set up on AIQ.

PS:- It is of vital importance to have a set of compatible indicators to confirm entries . Would a pair of large size shoes be compatible with very small pair of socks and a long trousers for a 4 feet tall man?

Tell me how to attach a chart and I post the ideal set up for DOW chart..
 
Copy and paste via paint shop pro or similar package...convert to giff format first. To capture screen , select one from multi mon setup, press " alt+ print screen" then paste into application such as psp.After "cropping" if needed save as dow.gif etc (mydocuments). When you post here, at the bottom of the edit form is a box called "browse". click that and up pops a mini explorer box....find your file dow.gif and click "open". Then click submit.
 
An excellent thread - nice charts Martin. Particularly interested in your use of CCI. Would be interested in hearing more. How did you go about selecting the period?

Grey - I'm looking forward to seeing your chart - your ideas sound interesting. Posting images here is a breeze.

Regards,
 
DOW set up

An IRD SET UP

This is a practical TA platform for precision trading. All indicators are compatible as far as acceleration is concerned. The stop loss can be set based on SAR indicator. Two 3 minutes time frames with a single 1 minute for sharp entries. The 10 minute chart to give us a next 10 minutes direction ( window to future) based on what is known as FIbonacci Peak signal (Not Fib Levels)

I have picked a tough example of trending day to show you how CCI ( on 1 minute frame) can be harmonised to stop giving whipsaws while following all minor movements. CCI is an oscillator but I have segmented the trending moves into small oscillation moves ( easily done on IRD) in such a way that CCI could detect the movements. The 1 minute chart can get you in to calling the bottom. Pretty sharp, However using a SB firm for most of you with their thieving Spread will not justify a 3:1 Reward/Risk hence other time frames to have as a back up.

The whole set up is based on Multi time frame analysis concept often used by institutional trader for parallel trading.

The whole analysis takes few seconds. One does not have to be rocket scientist to understand these signals.

The set up is a TA set up and CAN NOT COPE with SPIKES SUCH AS ANTRAX , BIN LADEN ARREST and stuff like that. News is however in the chart and does not affect analysis.

PS:- CCI has been harmonised by being regressed at around 40% level
PS:- signal starts @ 1 minute time frames IF and only IF larger time frame issue signals at the same time

PS:- Postion sizing of each trades must be calculated based on a risk managment system , designable in real time on IRD, needs a bit of work though.
 
Last edited:
Agree with RogerM this is a really interesting thread, looking forward to seeing this chart too, and putting into practice some of your suggestions Grey.

Thanks to some excellent posts by Grey and Chartman! :)

ps. Those SB spreads and price bias on movement are killing my profits.

pss. Looks like you just pipped me to the post Grey, and got your chart in whilst I was writing this post! Glad you got the hang of attaching images, charts look great! :)
 
Greys theory

Hello Grey,


Thanks for a very interesting looking post. As was humorously mentioned "one does not need to be a rocket scientist to understand the signals", but I`m not a rocket scientist and I still could not understand the signals!!! I had a look at your IRD charts and there seemed to be an awful lot more going on than simply using CCI as a way of getting in and out of positions. I spotted a PDI, ADX, moving averages, relative strength indicators, and bollinger bands, amongst other things on the charts and I would appreciate it if you could kindly clarify how you think these indicators should be used in trading, ie what are the values one might use to go long or short. For instance does one go long when the CCI climbs above a certain level or short when the moving average falls below a certain level? A worked example of what you mean would be very helpful if possible.

Once again thanks for adding to the quality of the debate with an otherwise very interesting post.

Good trading,


Andrew
 
Explanation

As a professional trader, I have found it is useless to have TA signals in single time frame. In another word if RSI > 30 in 1 minute chart then buy. This is naive trading and results in losses due to not representing the supply/demand correlation on the trading floor. Hence we trade in multiple time frames. Hence 4 windows in my chart. The 1 minute window is for precision entry as you can see the CCI is very sensitive even though has been smoothed.
A trade is initiated based on CCI signal issued on the 3 minute chart based on long +100 level touched short -100 level breached. If you did that you might not catch the trend at the bottom/top hence the 1 minute chart.

A stop loss is set onthe 3 minute SAR chart with parabolic indicator crossing the existing trend. ADX ,DMI only used as confirmation of exhaustion or continuation of trend, with ADX> 20 the trend does exit and at less than this value the trend exhaustion in force.

The last chart which is your longer time frame tells you if you have to be biased short or long for the day. LONGER TIME FRAME ARE THE KEY FOR TAKING A LONG TERM POSITION. A LONG TERM POSITION JUSTIFIES A PROFIATBLE TRADE BY GIVING 3 :1 Reward/Risk ratio.

Perhaps this all seems hard work and boring and not practical and all that but the fact is it takes few seconds and is very very practical and is a full set up for professional trading. Any thing else will not be mechnical enough bringing in emotions and maniac scalping of 2, 5 points here and there from fear of big losses. When the loss comes it takes all the points one scalped during the previous trading sessions + interest.

Trading is about one single fact:-

DO IT RIGHT OR LOSE.


ps:- I am still perfecting my set up but this a good start for those who like to trade for profit.

PS:- most of the indicators on my original post are not default indicators offered by commercial packages such as AIQ. They have actually been redesigned to reflect the character of stock/index under trade.

The above set up is for DOW intra-day. CCI has for example been calmed down by 40% to avoid maniac and silly irrational whipsaws.
 
Last edited:
I'm using Investor/ST and trying to program: Buy(Blue), Sell(Red) and warning (yellow) alerts on charts and sound alerts at same time.
Based on MACD and stochastics turns only here is Fiday's E S Mini..
 

Attachments

  • stochastic and macd chart.gif
    stochastic and macd chart.gif
    30.5 KB · Views: 1,296
I should have added:
1. It's a 1 minute chart: like Grey I look at other time frames.
2. Arrow with a Dot in middle = MACD oscillator Buy/Sell
3. Arrow with line in middle = stochastic Buy/sell.

I have for the sake of clarity compressed the indicator charts at the bottom of screen: normally they are open.
Next step is to look at Grey's indicators and try them as well.
 
Another strategy

Thanks to Grey and Mad for two very thought provoking contributions.

I recently finished reading Martin Prings "Technical anaysis explained" and on page 400 I discovered a very interesting strategy which Pring found to be very profitable in backtesting in the currency markets. I intend to test the system soon and possibly backtest it on tradestation 2000 with tickdata. His system used the pound/US dollar relation and has three indicators. Firstly there is a 10 week moving average crossover (of price). So a positive signal is given when price moves above the M.A. Conversely a sell signal is given when price moves below the M.A. Additionally there are two rate of change indicators (ROC) which Pring states sigificantly reduces the number of whipsaws (his published data appears to support this statement). The first ROC indicator is a 13 week ROC indicator. Buy and sell signals are triggered when the 13 week ROC crosses above and below its zero preference line. Next a 6 week ROC indicator was added which provided signals which are interepreted in the same fashion as the 13 week ROC. The crux of this strategy is that buy signals are triggered only when ALL THREE indicators go positive, and sell signals only when all three go negative. Pring (1991) noted that he backtested the above strategy between 1971 and 1983. During this period 10,000 dollars grew to over 4 million dollars by 1983. This was using a 10 percent margin position, although these days in the currency markets fifty fold leverage rather than ten fold leverage is common, so returns are potentially greater nowadays, all factors being equal. Pring also noted that his strategy worked profitably well into the nineties however there was no guarantee profitability would remain at that high level and also that his strategy worked best using the dollar pound relation. I don't think Pring was bluffing when he published the above strategy, which is why I have decided I will invest time and money backtesting it, when I eventually get the opportunity ( I will have to aquire the historical data first) but I hope to release the results here when I can.

I will not be contactable for the next couple of days as I will be redecorating my office!!

Good trading
 
I have now set up charts with Grey's indicators and shall program (big word: it's easy with the software I use: no need to understand anything but indicators and simple logic) alerts to tell me when to buy and sell.

With any luck I shall have a working system by Monday pm for trading S&P Monday pm..

Test it on FTSE first..

Must say I did use CCI but (and this is no criticism but a comment), Grey has been very taciturn on his use of indicators.. Trying o program them means you need to set out the rules... As a daytrader if I waited for CCI to hit 100 /-100 I would rarely trade more than once per week.. Howver, DI+/- give much more clear signals and are easily programmable so add that to MACD and stochastics in various time frmaes and I should have lots of buy/sell signals automated.

At the end of the day though no fully automated system is likely to work all the time and as Grey said it's a case of managing risk/reward...


However, I also have done a lot of work on intraday timing which is fascinating..
 
mad,
if you look at my charts you see CCI has been calling all tops and bottoms with great accuracy on 3 minute chart. CCI without smoothig would result in too many signal, hence the 40%regression to calmn down the indicator. This is the point i was trying to explain with regards to acceleration of each indicator.

Peg:-
You are right about Pring. He is of course not bluffing. Multi time frame analysis are often used by bot traders and even though it is a simple concept , not many traders are aware of this.
Most top traders use a single indicator in various time frames,,.
One of the best US traders that I know is Chris Narcouzi who uses ROC in price in various time frames and has had huge success with his indicator called KST. KST is weighted smoothed momentum indicator which takes 4 different ROC very similar to Pring's, except that Pring pring uses 12,18,24 month ROC ( he uses the intermediate ROC of 10,13,15, short term KST of 15,20, 30 and a 20 week ROC).

I have tried both above trader's indicators and I have now developed my own indicator which performS far betTer than both above researches and this is not to be a brag (let me know if you wish to see the Back tested results on FTSE100.

At the end of the day what counts is performance. My performance is pretty good.

If you wish to know about KST indicator send an email to
[email protected]

Those who are intrested in Martin prings work can look into MARTIN PRING ON MARKET MOMENTUM INTERNATIONAL INSTITUTE FOR ECONOMIC RESEARCH OR
SUMMED RATE OF CHANGE (KST) TECHNICAL ANALYSIS OF STOCKS&COMMODITIES VOLUME 10 SEP

IF YOU NEED FURTHER INFO LET ME KNOW

I AM CURRENTLY IN THE MIDDLE OF MAKING THE COMPLETE STRATEGY MECHANICAL TO GIVE BUY/SELL SIGNALS WITH VERY LITTLE NEED FOR INTERPRETATION. VERY MUCH LIKE OMNI TRADER'S SIGNAL GENERATOR BUT BY FAR BETTER. THIS WILL BE READY WITHIN NEXT 3 WEEKS OR LESS AND I POST THE CHART OF SWING TRADES WITH RESULTS IN HERE.

ONE THING IS FOR SURE, SIMPLE SUPPORT/RESISTANCE AND TRADITIONAL TA SIGNAL WON'T GIVE OUR TRADER'S THE EDGE.

GREY
 
Grey,


In the set up you are currently using what actually constitutes a buy/sell signal. If someone else tries to read your post it is not clear exactly when they would be buying or selling? Please can you clarify it, as not all traders on this fine bulletin board have read Pring`s work regarding mutil time frame analysis.
 
Multi Time frame

The signals are mean reverting signals of CCI from 3 minute chart. The system fires a buysignal when the indicator approaches the -100 and reverses and short when + 100 and reverses. A trader then positions him self when the 1 minute confirms the 3 minute signal. In another word, the final Signal comes from 3 miniute signal + 1 minute signal.

A trader has two choice:-
To accept both long and short signals or just be biased toward one. The 5 minute chart should further clarify this. If RSI is at OB levels then he only takes the short signals and visa versa.

As you can see, back up after back up in different time frames.

I
 
Many thanks Grey for your input.
I have now programmed a simple marker to buy if ROC>100 and MACD oscillator has crossed up and sell if ROC<100 and MACD oscillator has crossed down.

Seems to work very well with FTSE this am (was out so did not trade it) but will try out on S&P this pm.. In different time frames seems OK but can be bounced up bit when price consolidates so a few refinement needed..
 
Atached are the results on todays S&P. The basic scheme is the bigger the arrow the stronger the signal and the more of them the more persistent the trend. Various indicators are used but the best so far is the big arrow which is a mix of ROC and MACD.
 

Attachments

  • testgif.gif
    testgif.gif
    31.4 KB · Views: 553
Top