You are using an out of date browser. It may not display this or other websites correctly.
You should upgrade or use an alternative browser.
You should upgrade or use an alternative browser.
fibonelli
Experienced member
- Messages
- 1,338
- Likes
- 288
I don't trade breakouts because I prefer to re-enter into an existing trend.
This thread may be helpful
Good vs Bad Breakouts
http://www.elitetrader.com/vb/showthread.php?threadid=49416
This thread may be helpful
Good vs Bad Breakouts
http://www.elitetrader.com/vb/showthread.php?threadid=49416
Hi everyone,
I have been spread betting lately and am still eally new to it, but I wondered what indicators you guys used to 'confirm' a breakout ?
many thanks
Jackie
Hi Jackie
There is no such thing as an indicator to 'confirm' a breakout. So, if you want to take my polite advice, stop wasting your valuable time looking for one. There are, however, certain 'things' that can help find breakouts that have a better probability of achieving what you might be looking for than others do.
This probably sounds like a very unhelpful thing to say. But I assure you it is not!
Cheers
Steve
Last edited:
Jackie
So, let me add to this (by way of example).
You want to look for a healthy increase in Volume to 'support' the breakout. This is Key. But, don't forget that by using the term 'breakout', you are refering to an instrument who's price is 'breaking' above (for a Long) a previous Key Resistance level. So, what if there happens to be another Key Resistance Level near above the one you are looking at?
Cheers
Steve
dbphoenix
Guest Author
- Messages
- 6,954
- Likes
- 1,266
Jackie
So, let me add to this (by way of example).
You want to look for a healthy increase in Volume to 'support' the breakout. This is Key. But, don't forget that by using the term 'breakout', you are refering to an instrument who's price is 'breaking' above (for a Long) a previous Key Resistance level. So, what if there happens to be another Key Resistance Level near above the one you are looking at?
Cheers
Steve
You take it anyway, because you have no way of knowing whether price will barrel through the next level or not.
Db
dbphoenix
Guest Author
- Messages
- 6,954
- Likes
- 1,266
True. But, DB, would you prefer that there is a key Resistance near above or not. Tell me: which would you prefer?
Steve
Given that price has already broken through "key resistance" and yet more "key resistance" is near, how are you defining "key resistance"?
Db
dbphoenix
Guest Author
- Messages
- 6,954
- Likes
- 1,266
Hi Db,
I am just trying to help less experienced traders understand some key points. Diferent timeframes have diferent Resistancesfor example, IMO. Do you not agree?
Cheers
steve
True, but there will always be resistance somewhere. If one were to wait until he cleared all of it, he wouldn't be trading much.
Db
Hi everyone,
I have been spread betting lately and am still eally new to it, but I wondered what indicators you guys used to 'confirm' a breakout ?
many thanks
Jackie
Indicators are late, but I do like the look of a higher low on an indicator in combination with a lower low on the price chart, on a rising trend, and the reverse in a falling trend.
As far as a breakout is concerned, I take that off the price chart.
As db suggests, as far as looking for S/R is concerned, if you go grasshopping from one time scale to another you'll not trade much.
Split
fibonelli
Experienced member
- Messages
- 1,338
- Likes
- 288
......... but I do like the look of a higher low on an indicator in combination with a lower low on the price chart, on a rising trend, and the reverse in a falling trend..........
Split
Hey Split,
Shurely shome mishtake? 😉
counter_violent
Legendary member
- Messages
- 12,672
- Likes
- 3,787
Hey Split,
Shurely shome mishtake? 😉
Split is talking about divergence I think.
cv
Last edited:
Crap Buddist
Senior member
- Messages
- 2,458
- Likes
- 289
Your amazing you are and I havn't even started chopping it yet..
If one is long & the price keeps on going up then its confirmed. .
Dont think. Trade. But theres knowing when you'll get paid to Fade? (not a Joe Ross slogan,so i'll bag it... )
Chop, chop, chop, creak crack, timberrrr.. at what point does one know the BIG tree is about to fall ?
Your amazing you are and I havn't even started chopping it yet.. trades4U
Hi everyone,
I have been spread betting lately and am still eally new to it, but I wondered what indicators you guys used to 'confirm' a breakout ?
many thanks
Jackie
If one is long & the price keeps on going up then its confirmed. .
Dont think. Trade. But theres knowing when you'll get paid to Fade? (not a Joe Ross slogan,so i'll bag it... )
Chop, chop, chop, creak crack, timberrrr.. at what point does one know the BIG tree is about to fall ?
Your amazing you are and I havn't even started chopping it yet.. trades4U
rathcoole_exile
Guest Author
- Messages
- 3,925
- Likes
- 767
higher low on an indicator in combination with a lower low on the price chart, on a rising trend
makes sense to me ! but I agree Split could maybe have just summed it up in one word.
unless Split was concerned he'd get a lot of newbie questions about what the D-word means ? 🙄
Chorlton
Established member
- Messages
- 693
- Likes
- 48
Hi everyone,
I have been spread betting lately and am still eally new to it, but I wondered what indicators you guys used to 'confirm' a breakout ?
many thanks
Jackie
Indicators have their use, but IMO not when it comes to Break-Outs. To successfully trade them you need to concentrate on price action & volume. Indicators by their make-up with only offer a signal once the break-out has already happened. Not much use unless you are trading long-term.
I'm assuming by your post that you are only interested in the actual "break-out". But what are you defining as a break-out? Break-Out from what?
IMO to be successful in trading one of the keys is to concentrate on low-risk set-ups. To increase the odds in your favour you want to look for break-outs which suggest that they will be favourable. Volume can offer the key here together with the relationship between the high/low and close of the current bar. This is VERY important IMO.
Additionally what does the chart to be recent left of the current bar look like? In other words what has price been doing prior to be price move? This can normally offer valuable clues as to what may happen in the future.....
But to get back to my main point: Don't rely on indicators.........
All the best,
Chorlton
black bear
Guest
- Messages
- 1,303
- Likes
- 165
Simple Index Breakout
Hi Jackie,
Glad to see your making progress, DEMO ACCOUNT I HOPE :?:
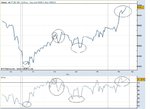
Not sure if your trading index or individual shares but here"s a simple and very good example of an open range breakout on Ftse yesterday.
I assume you probably have no access to live volume :?: but IMO the example below is pretty safe as long as you wait for pull back before entry.
Breakout defined by open hour range. You could target previous days High or Low and use that info to decide if it presented a low risk trade or not :?:
More detail (was going out earlier 😆 )
The example, open hours range of ftse index was at the previous days high, I think about 93, early test above and the index traded lower making and looking without the benefit of hindsight to maybe trading lower for the rest of the day :?:
I entered the lower break of the opening hours range at the pull back, but was aware I was against the trend. The way I and I think most would judge the trend in the higher time frames (month,week & day)
Exit was for +1.5 pts about entry following the failed re-test of last low on the chart, if I had waited till index re-captured range it would have resulted loss of -12 pts.
Index rallied for a whatever period and took out yesterdays high at 93 and the high of the open hour range, hesitated and made small pull back giving a good long entry on top of the range, The entry was in line with the longer term trends. Stop of 12 - 15pts would have been plenty IMO to give the move a fair go. If it moved sharply back into and under the open hours range and previous days high, all bets off for me at any rate.
I neglected to say how many pts I made on the second entry because it was such a pitiful amount 14 pts in fact 😱 😱 😱 , I was going out right :!: I wanted my dinner :!: and the US was opening in an hour or so 😆 😆 and another valid reason was it was Friday, and I didn't want to give any back 😕 😕
Last point, in my experience which is not extensive by any means, a good break moves fast and your entry is usually made on a fast bar breaking from the pull back. You must IMO not be afraid to enter because of this or you will miss the move, often indicators are already overbought etc when the break comes, the moves are often gravity defying and fast until they exhaust themselves. Splits trend lines are fine for spotting this, not an instrument they will often take you out of the move prematurely.
If you have access to volume, and when you get more experience you can enter on the break itself, I would just let those trades go till you gain more experience or you will expose yourself to a lot of whipped entries which will lower your confidence.
EXAMPLE PRESS + button, lower line not showing up till you do
Hi everyone,
I have been spread betting lately and am still eally new to it, but I wondered what indicators you guys used to 'confirm' a breakout ?
many thanks
Jackie
Hi Jackie,
Glad to see your making progress, DEMO ACCOUNT I HOPE :?:
Not sure if your trading index or individual shares but here"s a simple and very good example of an open range breakout on Ftse yesterday.
I assume you probably have no access to live volume :?: but IMO the example below is pretty safe as long as you wait for pull back before entry.
Breakout defined by open hour range. You could target previous days High or Low and use that info to decide if it presented a low risk trade or not :?:
More detail (was going out earlier 😆 )
The example, open hours range of ftse index was at the previous days high, I think about 93, early test above and the index traded lower making and looking without the benefit of hindsight to maybe trading lower for the rest of the day :?:
I entered the lower break of the opening hours range at the pull back, but was aware I was against the trend. The way I and I think most would judge the trend in the higher time frames (month,week & day)
Exit was for +1.5 pts about entry following the failed re-test of last low on the chart, if I had waited till index re-captured range it would have resulted loss of -12 pts.
Index rallied for a whatever period and took out yesterdays high at 93 and the high of the open hour range, hesitated and made small pull back giving a good long entry on top of the range, The entry was in line with the longer term trends. Stop of 12 - 15pts would have been plenty IMO to give the move a fair go. If it moved sharply back into and under the open hours range and previous days high, all bets off for me at any rate.
I neglected to say how many pts I made on the second entry because it was such a pitiful amount 14 pts in fact 😱 😱 😱 , I was going out right :!: I wanted my dinner :!: and the US was opening in an hour or so 😆 😆 and another valid reason was it was Friday, and I didn't want to give any back 😕 😕
Last point, in my experience which is not extensive by any means, a good break moves fast and your entry is usually made on a fast bar breaking from the pull back. You must IMO not be afraid to enter because of this or you will miss the move, often indicators are already overbought etc when the break comes, the moves are often gravity defying and fast until they exhaust themselves. Splits trend lines are fine for spotting this, not an instrument they will often take you out of the move prematurely.
If you have access to volume, and when you get more experience you can enter on the break itself, I would just let those trades go till you gain more experience or you will expose yourself to a lot of whipped entries which will lower your confidence.
EXAMPLE PRESS + button, lower line not showing up till you do
Last edited:
makes sense to me ! but I agree Split could maybe have just summed it up in one word.
unless Split was concerned he'd get a lot of newbie questions about what the D-word means ? 🙄
Is that what it's called 😆 I've been all this time thinking that it was invented by me 🙁
Whatever it is, there's plenty of it about. I enclose ten days of October and as a Freebie, there's one for Monday on the end.
Attachments
Split,
Your chart is showing bullish regular divergence which forms in a downtrend (alt: minor retracement of an uptrend) and bearish regular divergence which forms in the mature phase of an uptrend.
Divergences happen often!
F
Don't care ! :cheesy: You guys trying to confound me with all this high fallutin' language? 😀
I use them to trade and they work.
BTW, I've been out all day and I'm a little bit merry because I've been celebrating some of the divergences I've been having this week. 😀
Split
Similar threads
- Replies
- 11
- Views
- 4K
- Replies
- 69
- Views
- 17K
- Replies
- 0
- Views
- 3K