0007
Senior member
- Messages
- 2,377
- Likes
- 665
Does anybody use or have knowledge of RFI ?
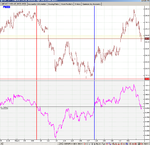
Can't find any references except MILLARD's book "Profitable Charting Techniques" He designates it as useful for detecting breaks in trendlines. R-F charts have a time axis (horizontal) but no price axis - the vertical axis is a direction indicator which has a nominal mid value of 100. To plot: rise in price = 1 step up, fall = 1 step down, no change = 1 step horizontal. You end up with a line chart upon which you can fit trendlines and / or deduce what you will.
Can't find any references except MILLARD's book "Profitable Charting Techniques" He designates it as useful for detecting breaks in trendlines. R-F charts have a time axis (horizontal) but no price axis - the vertical axis is a direction indicator which has a nominal mid value of 100. To plot: rise in price = 1 step up, fall = 1 step down, no change = 1 step horizontal. You end up with a line chart upon which you can fit trendlines and / or deduce what you will.