Wot happened next?

barjon

Legendary member
Messages
10,752
Likes
1,863
Just for fun since the board's are a bit quiet :cheesy:

Here's an instrument that has been steadily rising for some time. It appears to have made a double top and the latest action is some 15 bar consolidation within the boundaries of the long candle of the second high.

Do you favour a move north or south? And how would you trade it assuming it moves in the direction you favour and/or you are inclined to wait and see?

good trading

jon
 

Attachments

  • wot2.JPG
    wot2.JPG
    25.6 KB · Views: 533
I'll guess that after a 1 or 3 candle pullback toward the middle low of the 15 candles the price rallies.

However there isn't enough info to work with; I'd want to see W and M charts and apply some fibo levels and maybe channels to obtain price targets.
 
Quick reply during half time Barjon.

There's been three attempts to break north and a rising trend line. I'd wait to see which one breaks before making a move. I'm inclined to side with going north though when you look at the rising Support lines.

Do tell
 

Attachments

  • chart.JPG
    chart.JPG
    28.7 KB · Views: 403
Trdr said:
I'll guess that after a 1 or 3 candle pullback toward the middle low of the 15 candles the price rallies.

However there isn't enough info to work with; I'd want to see W and M charts and apply some fibo levels and maybe channels to obtain price targets.


trdr

Nah, it's my game - this is all you've got :cheesy:

slap

so how'd you trade it if it did?

jon
 
barjon said:
trdr

Nah, it's my game - this is all you've got :cheesy:

slap

so how'd you trade it if it did?

jon

Wait for the candle to break through and then one more clear of the line, i.e clear confirmation of the trendline being broken. Doesn't always work that way though :confused:
 
barjon said:
Do you favour a move north or south? And how would you trade it assuming it moves in the direction you favour and/or you are inclined to wait and see?
Hi Jon,
Excellent idea for a 'summer thread' - as you say, 'tings are a bit quiet at the moment.

I don't have the skills to take your chart and add trend, S & R, supply and demand lines etc., so I'll just make a few general observations.
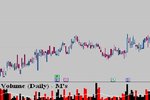
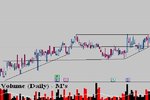
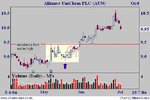
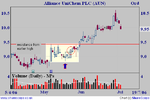
1. Is there a correlation between large price movements and large volume? Take the p/v combo at 'D' (some event of some sort, presumably?). Big bull candle and big volume to match. However, there's no follow through, which causes me to question the strength of the demand.
2. This view is supported by the fact that the high at 'D' is yet to be breached.
3. The earlier volume high (the highest on the chart) is accompanied by a very tight tug 'o' war between the bulls and the bears. Not quite a doji, but equilibrium by anyones standards. The old adage 'if it can't go up, then it must go down' springs to mind here, which is what the price then does, but not with any real enthusiasm. Certainly, at this juncture, it would be hard to argue that the bears are in control.
4. So, to conclude, could this instrument be in a base and is under accumulation? Distribution looks unlikely in as much as the trend (in so far as there is one) is up and, more importantly, there doesn't appear to be an excessive amount of supply. If there was, we might expect to see large bear candles accompanied by low volume.
5. Finally, to answer your question, at a push I favour a price advance on the grounds that recent price action indicates rising demand (successive higher lows), but I'm concerned by the 'spikeness' of the bullish price candles which are way too tentative for my liking. In the event that price breaks out to new highs on strong volume and, having done so, there is a weak pull-back on low volume, I would consider going long. Otherwise, this is one to watch from the sidelines, IMO.
Tim.
 
Hey there,

What format is the attached thumbnail in? This is one of those times that the thumbnail isn't showing up for me. All my settings are correct so I can only assume I just don't have the program or something needed to see the thumbnail.

Cheers,
PKFFW
 
What Jon hasn't told any of you is that where the 'X' is marked on his chart represents the date as of the initial post in this thread. All the rest is his predictive work on precisely where the price will go. Along with the volume. Fantastic stuff Jon.

Jon's seeing both Resistance and Support, calling it a consolidation, but it's still 'showing' trend support with little interest to the downside and some 'fairly obvious' support. Accumulation? No. Don't think so. If it did break above the current level of Resistance and re-test to confirm new Support, yes, it would be worth taking a long position with a stop just under that level.

But my own take is that this is potentially the quiet distribution before the sell off. Any high momentum/volume move below the area of Support (2 points) would be a potential short setup with a stop half way up that long candle 15 bars back.
 
good goin' chaps :D - either initial direction or trade if northerly break

This is what happened. It interested me as it developed in the white rectangle starting with the long up candle on high volume which backed off from the resistance of the previous high. Long candles on high volume are often followed by the opposite direction (open to close) the next day, that happened here but with no great enthusiasm. Another test of resistance and then I got a potential swing low - blue arrow -which bounced off the support of the long candle's low. FTSE was falling quite steeply throughout all this.

That swing low gave me an entry 3 days later - red circle - which I didn't take (well, I knew better than the plan didn't I :eek: ). Break out a few days later and a couple of pullbacks for long entry although the first might have been dodgy if your stop was too close.

Do you want another one :?:

good trading

jon

ps: thumbnails are same chart in two formats in case anyone is having trouble
 

Attachments

  • untitled.JPG
    untitled.JPG
    35.8 KB · Views: 368
  • untitled.PNG
    untitled.PNG
    16.6 KB · Views: 296
Entertaining thread

barjon said:
good goin' chaps :D - either initial direction or trade if northerly break

This is what happened. It interested me as it developed in the white rectangle starting with the long up candle on high volume which backed off from the resistance of the previous high. Long candles on high volume are often followed by the opposite direction (open to close) the next day, that happened here but with no great enthusiasm. Another test of resistance and then I got a potential swing low - blue arrow -which bounced off the support of the long candle's low. FTSE was falling quite steeply throughout all this.

That swing low gave me an entry 3 days later - red circle - which I didn't take (well, I knew better than the plan didn't I :eek: ). Break out a few days later and a couple of pullbacks for long entry although the first might have been dodgy if your stop was too close.

Do you want another one :?:

good trading

jon


ps: thumbnails are same chart in two formats in case anyone is having trouble
Jon

In response to your last question - yes please. I wanted to post a response to the last one, but I had some other stuff I had to do and couldn't devote enough time to do a proper response, although I was following the thread with interest.

It's a bit of fun, but I think it is really valuable because you get responses from people following all types of strategy and comparison of these on a specifc topic is valuable. I suppose the only problem is that if you follow strategies that are not just price/volume/pattern related then you might have problems applying them to your charts, so these certainly favour the dark-side !

For the next one, can you tell us when you will reveal the answer, so we know how long we have to respond ?

With regard to commenting on the chart, it may be worth saying what tools can be used. There is the tool that everyone is likely to have (PAINT). Another good tool for making comments, drawings etc on a posted chart is SNAG IT. It costs about $40 but is very useful for training material, Anyone has other suggestions ?

Anyway - a good, entertaining and educational thread, so please give us more

Charlton
 
Personally I use Paint, easy enough to draw lines insert text etc, and after all it's part of windows and therefore a freebie
 
dbphoenix said:
For the most part, as is often/usually the case, volume follows price.
Hi dbp,
Just to clarify, are you saying that the current volume relates to - and is a consequence of - price action X candles/bars ago? Or, are you being more literal, saying that volume shrinks as price contracts and becomes range bound and, conversely, volume expands when price moves strongly (be it up or down)?
Perhaps you mean something different altogether!?
Cheers,
Tim.
 
Volume follows price - generalisation or specifics ?

dbphoenix said:
It's worth noting that volume tells its own story throughout, but isn't all that useful in terms of predicting what's going to happen next.

Also worth noting that the volume on the breakout isn't all that special. In fact, very little of the volume thereafter is all that interesting. For the most part, as is often/usually the case, volume follows price.
DBphoenix

I am intrigued by what you are saying,because perhaps wrongly or because I have not analysed your postings suffiiciently in the past, I assumed that you advocated a very definite correlation between price, price spread, volume and the actions of professionals, the herd, strong and weak players.

Are you saying that large volume does not indicate the activity of the professionals ? And does volume not indicate whether it is weak or strong players behind the price action ?

I can understand that volume follows price when the herd follows, but not for professionals.

Or are your comments limited to the period just after breakout ?

Charlton
 
dbphoenix said:
I've never advocated the correlations that Charlton mentions because none of that matters to me. Nor do I use volume as an indicator. Nor does it matter to me where the volume is coming from.

Note in the chart I've attached that there is nothing remarkable about trading activity at the BO (red). In fact, trading activity does not increase until two days later (blk). Whether or not it was "professionals" who moved the price past R is unimportant to me. Trading activity increases even more the day after, but buying pressure clearly outweighs selling pressure since a very NRB hangs at the midpoint of the immediately-preceding WRB. When price drops the next day (blu), trading activity is less, suggesting that sellers may be "done". Next bar, trading activity increases again, buying pressure outweighs selling pressure since price rises and holds there.

Next bar (grn), trading activity is as low or lower than its been in a month or more, but price holds where it is. Buying pressure and selling pressure are in balance. Next bar, price moves in a substantially wider range, but trading activity remains the same. BP and SP remain in balance.

Next bar (pink), trading activity increases, price advances, BP beats SP. Ditto bar after that. When trading activity increases even more in the next interval (ylw), due perhaps to price having made a new high, SP appears to have the upper hand, esp since price cannot be driven below the PDC.And so on.

Volume is not an indicator and the "bar" is nothing more than a convenience. All that matters are trading activity, buying pressure and selling pressure, and how imbalances between them move price. Volume has no meaning in and of itself. It is neither strong nor weak. It just is.


Interesting, db. Thanks

I'm with it except the red highlight. I can see that SP ruled after the upward gap open but PDC seemed well defended by buyers and couldn't it be said that SP lost the upper hand at that point?

good trading

jon

ps: any volume interest within the white rectangle? Didn't seem all that "quiet" and the higher than average volume seemed associated with a rejection of higher and lower prices (within the range).
 
Whoever said that dbphoenix knowledge and the views that he has expressed here are some “tablatures in stone” anyway? And in his defence when has he ever advocated the use of volume affects his decision in trading. And even if he did, isn’t he entitled to change his view.
 
dbphoenix said:
For the most part, as is often/usually the case, volume follows price.
dbp - an interesting rejoinder. But I wonder if the volume causes price; price causes volume view of market mechanics can ever be clearly described without the critical component of Time being brought into the discussion? Unlikely.

For instance, heavy accumulation but over a relatively long period of Time does not cause the same effect on Price as does that same amount of Volume over a shorter period.

edit: {addition of text}

To expand on my example. Accumulation over a longer period of time will not give any apparent bias to either Selling Pressure or Buying Pressure. It's typically (hopefully for those accumulating) a period of flat consolidation.

But the location of the consolidation in relation to previous price/volume action and the very absence of noticeable volume/price activity is itself the very clue to what is going on.

Contrast that with increasing Volume on a relatively flat line price curve. What would that tell you? Something very different! Of course volume has a part to play.
 
Last edited:
Hey guys, please don't this thread degenerate into knocking contributors :(

It's supposed to be a bit of fun with some underlying education thrown in :cheesy: Everyone is invited to have a go at some analysis and associated trading ideas whether they be beginners or experts. There are bound to be different views and disagreement, but I hope people will always concentrate on explaining why an analysis is faulty rather than just rubbishing it and/or the contributor. Anyway, contrary to popular opinion, most members have a lot more savvy than to accept anything anyone says as gospel :)

This first one seems to have a bit longer to run so I'll do the next one over the week-end (and I'll include a "solution" date charlton :cheesy: ) unless it looks like interferring with discussion of the first.

cheers and good trading

jon
 
Hi ratsystem,
A provocative first post, especially as it's aimed at dbphoenix who is, for the most part (we all have our detractors), very well regarded on this BB. Obviously, I speak as one of the flock - well, more of a black sheep I suspect, but that's another story . . . Anyway, call me old fashioned, but it's sort of normal to establish some degree of credibility before lambasting other long standing and well respected members. (Apologies if you're some famous trader known to everyone but me). This break with 'tradition' does not worry me as such, however, if you want your comments to be taken seriously, may I recommend the following . . .
1. You claim that dbp is "clouding his followers minds with disinformation". How? In what way, precisely? Please give examples - the more the better. This leads to (in your words) "blind and dumb sheep". This is especially perplexing, because, of all the 'gurus' on these forums, dbp has been consistent in encouraging traders to think for themselves about market psychology and who has the most to lose or gain by the current price action. This is a far cry from the usual 'follow me to the Holy Grail and do as I say' type of guru. Actually, to be honest, as a guru, dbp breaks the mould. He tends to alienate his 'disciples' and embraces his critics: not normal 'guru' behaviour in my experience. (Note, please, that he has not replied to your post or that of mr marcus') Anyway, moving on; for your comments to be taken seriously, may I also suggest that you . . .
2. Offer an alternative. The inference from your remarks - and those of mr marcus - is that there is another way - a better way. Additionally, it is reasonable to assume that while you may not sympathise with dbp, you are concerned for the 'sheep' who latch on to his "misinformation". On behalf of the sheep, if you have a better way - or even just a different way - please share it with us so that we may have the opportunity to decide which path suits us best. Any politician will tell you that to criticise the opposition without offering a viable alternative is not only a waste of time, it's totally counter productive.
Welcome to T2W!
Tim.
P.S. Given that you are new to T2W, I would not have bothered with any of this, but for the fact that (very surprisingly) your post is endorsed by mr marcus - for whom I have great respect - as do many others here.
 
Last edited by a moderator:
Volume follows price or price follows volume?

"Follow" seems to be an imprecise term, though we all know what it means.

To quote from my coursework in the Bleedin' Obvious masters from the University of Parochial Polly:

Last traded price cannot move without volume, by definition.
Bids and asks can of course change in its absence. Sometimes there will be a gap, as perceptions of value are dramatically changed in the absence of any trades, but it is reasonable to say that in market hours bids or asks must usually be eaten by volume in order to move them to a new level. Thus volume usually causes price change.

A change in last traded price (and the subsequent reshuffling of bids &asks ) can then in turn attract fresh volume, as perceptions of value change following the last trade.

Thus price change begets volume (that would not otherwise have entered the market at the previous price, at that precise moment). Time is certainly key here as Tony says.

Perhaps in general volume causes volume and price is merely a convenient way of noting where this happens.

My point is that wondering which leads which is a circular and unrewarding semantic argument. What is far more interesting is to question the "why" of PV not the supposition that one has caused or been caused by the other.
 
Top