Support and Resistance help

roy12

Junior member
Messages
17
Likes
0
I have been trying to learn about support and resistance. I was following the FTSE100 index today and have tried to plot all the support and resistance levels that I can see on the chart.

I have added the chart on here too:
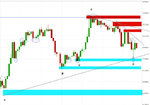
The bottom line is the support
The middle line is the resistance and new support
The top line is the new resistance

Any help on if I am correctly identifying them would be great.

1fk3fk.png
 
Looks ok, I'd be tempted to ignore the middle line on future bars though but we all see things differently. I always find it's best to think of S/R as zones and not exact lines.
 
Ok thanks.

I was looking at a signal near the top resistance where sellers started to change the direction.

I added the chart here, do you think this signal is valid? I did watch it live and it would have worked - but just wondered if any others would have used this as a signal to sell?

657c6e.png
 
Given the chart you posted below is how I would have seen it insofar as potential supp/res, and I would have drawn fibs from swing points A B and C to Z, with some unbreeched fibs still remaining of the swings A-Z, and B-Z, and I woulld have added the trend lines as shown. I would also have fibbed swing Z-D. It is not clear from your chart whether the area circles at bottom left of your chart is a swing point but if it is was I would have added that as a potential resistance becomes support swing zone albeit non-immediate and probably weak.

We all do things differently but however you do it - make it a repeating methodology.

G/L
 

Attachments

  • Z.jpg
    Z.jpg
    100.1 KB · Views: 372
Top