You are using an out of date browser. It may not display this or other websites correctly.
You should upgrade or use an alternative browser.
You should upgrade or use an alternative browser.
JFK
Member
- Messages
- 71
- Likes
- 0
Agree – what’s your target?twalker said:Looks like it is good to be short here.
Anybody disagree?
What are you using as confirmation? why didn’t you take the short from the previous day’s close below the line?
JFK
Member
- Messages
- 71
- Likes
- 0
Like most newbie’s, stops can be the trickiest things to master. I often get caught out just before a big move & then find it difficult to get back in.
Do you use a % or a set amount of points to trail? If so & you are screen watching, do you change them during trading or EOD?
Many thanks
p.s. If you think I’m asking to many Q, just tell me to get lost – I’ll understand.
Do you use a % or a set amount of points to trail? If so & you are screen watching, do you change them during trading or EOD?
Many thanks
p.s. If you think I’m asking to many Q, just tell me to get lost – I’ll understand.
TWI
Senior member
- Messages
- 2,562
- Likes
- 269
LoL, no worries about questions, seems to be what these forums are for..
I use all sorts of reasons for stops but when I put on a position based on the criteria used for this particular trade i.e. the downtrending resistance I then put the stop a little above the last high in the channel. Currently this is a long way away and with my position size it will mean giving back a lot of money so I may lose my discipline/bottle for a proportion of it before that, in order to ensure I end with at least a +ve PnL should I get stopped. I will try not to but I find usually if I can take a partial position off to ensure that if the balance gets stopped I still retain a profit I cannot stop myself. this may be what is stopping me from reaching greater heights in the trading world...but it just works for me.
I will trail the stop if I get a second down week to the high of the previous week but that will not be static, depends how the daily chart looks. I change them as and when it seems appropriate but in this case I will not go below daily resolution . The only defined stops I use are on systems which require that sort of thing. It really depends on your timescale. If trading intraday then stops are far more dynamic than daily or weekly. There is a thread discussing these things going on right now.
I have never considered myself an expert on these things and often get out too early. On the other hand you only tend to remember the "shoulda, woulda, coulda" ones that create pain and not the ones you got right. Money management is the hardest part and I don't know that you ever perfect this, I have been trading since 1991 and still know so very little about it.
JFK
Member
- Messages
- 71
- Likes
- 0
How many points do you think "shoulda, woulda, coulda" be made trading the S&P like this per year?
BTW at what point in your reckoning did you view it ‘scaling into short’? Was it the first two weeks of September or the third?
I’m out of here soon, as I have family over. Perhaps we can continue this next week to see how the bottle is going. Or has it gone already? Its looking close to yesterdays high, are you going to stay short over the weekend?
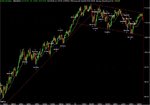
p.s. where do the BearBuy & BearSell signals come from on your chart?
BTW at what point in your reckoning did you view it ‘scaling into short’? Was it the first two weeks of September or the third?
I’m out of here soon, as I have family over. Perhaps we can continue this next week to see how the bottle is going. Or has it gone already? Its looking close to yesterdays high, are you going to stay short over the weekend?
p.s. where do the BearBuy & BearSell signals come from on your chart?
littlechops1
Junior member
- Messages
- 24
- Likes
- 2
Hello all on this thread,could anyone let me know a who is the cheapest "live" data for the S+P,or maybe the question should be who gives value for money regarding data for the S+P,I would be very grateful if anyone could let me know,also could i just ask if the posters on this thread if the S+P is the only thing they trade while the market is open (daytrade)reason being, if so,maybe my points of interest while trading could be posted to back up my descion for entry and exit,
littlechops1
Junior member
- Messages
- 24
- Likes
- 2
E-mini feed
regards ROB
Hi thirteen, thanx for you reply,I have had live data before from e-signal, but the price was high, around $200.00 or so a month, this was for the charting too,i am looking for a sight that you can log into and receive a live chart of the S+P with live feed, I asked the question if there was anyone else out there who does it for a bit less (suppose asking cuts out lots of time trawling through all sorts of sights)I do realise that cheapest isnt always the best,having said that this trading thing is never cheap especialy if you loose,what site could you reccomend to look atThirteen said:lamb chop - dont pay more than $16 for an emini feed. the price is set by the exchange. dont go for qcharts as this is 4 ameturs and you will lose more money from bad data than you will save from going with a better package -he who pays cheap pays twice 😉 having said that sierra and quotetracker are said to be ok and free - you just cough up 4 the data elsewhere.
twlker - ride 'em cowboy!
its gunna rocket soon though - but probably not till the us election for chief clown is over
regards ROB
JFK
Member
- Messages
- 71
- Likes
- 0
Hi littlechops1,
I did use eSignals at the beginning of the year & it only cost about $75 per month. I found I don’t have the time to day trade & screen watching meant I would stop thinking about the overall picture of the markets. So I’ve gone back to basics, I’m trying to find an EOD system that holds a position form a couple of days to a couple of weeks. I view the action of the S&P 500 & what has happen during the day using the FT.com site (& find the less TAs the better). Plus, while I’m working on a set of rules to stick to I’m not wasting money on data feeds. Currently I only SB S&P500 & FT100.
I agree with thirteen, don’t go cheap but only pay for what you need. Beware of the latest & greatest magical fondue indicates these guys keep producing. What works today doesn’t always work tomorrow. They usually stop working just after you increase your trade size!
Shame they can’t put Bush on the rocket! They should allow Ronald McDonald to run again for President, ever lard ass in the USA would vote if they could get off their backsides & he’s already had the experience.
Twalker – R U still short?
Attachments
littlechops1
Junior member
- Messages
- 24
- Likes
- 2
Hi JFK,just in from work,looks like a good short to have taken out at open,currently using ADVFN charts at the mo, does'nt seem to be any volume though,
ROB
ROB
JFK
Member
- Messages
- 71
- Likes
- 0
I was just looking at the Price, (Volume), Support, Resistance, Demand, Supply . . . thread. I am going to start using the http://www2.barchart.com/mktcom.asp?section=indices site to see if the futures volumes helps to give me any answers?
JFK
Member
- Messages
- 71
- Likes
- 0
It looked like something was going to happen, but I was not expecting to come back to that kind of move! I closed my position on Thursday & had a long weekend. Hindsight is great, but I think some of the answer to the end of the short were there during the week with the slow action helping as an indicator to the new support/price levels, but as for Friday??? Where the feak did that come from??? I missed it, I guess that will teach me for thinking I could have some time off!
Is this going to make any new highs, or was it just a quick jump to make Bush look good during the debate?
Is this going to make any new highs, or was it just a quick jump to make Bush look good during the debate?
TWI
Senior member
- Messages
- 2,562
- Likes
- 269
I am definitely going to stay away and if it breaks back into the channel short it again.
Where did all the talk on wall street of "If oil stays above $40 for any time it will be a problem for the equities"?
Are the bond yields just making the equities look more attractive? or are we seeing a pre-election hype and the PPT are in there playing their games to keep the Bush/Cheney roadshow on track?
non-farm should be an interesting figure. I can't help thinking it will show solid growth, after all leadership of the World (apparently) is at stake here.
JFK
Member
- Messages
- 71
- Likes
- 0
I’d go for the hype (as I haven’t learnt much about bonds yet), better the devil you know.
Friday could be another big pre-session move – if unemployment is higher the markets should go down just like you quoted the “oil price goes up the markets go down”! What ever the results it doesn’t make sense, so I’ve stopped forming an opinion. I think I’ll carry on working on a strategy & wait for another signal. Maybe after the election.
Friday could be another big pre-session move – if unemployment is higher the markets should go down just like you quoted the “oil price goes up the markets go down”! What ever the results it doesn’t make sense, so I’ve stopped forming an opinion. I think I’ll carry on working on a strategy & wait for another signal. Maybe after the election.
frugi
1
- Messages
- 1,843
- Likes
- 133
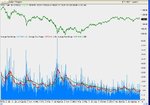
Sorry to hijack this thread but I wanted to post this chart of the S&P with ATR for another forum member who asked me to.
Blue bars are 1 day ATR, red line 10 day and green line 50 day.
I suspect it may increase from here (more volatility) as the 50 day rarely dips below 10.
Blue bars are 1 day ATR, red line 10 day and green line 50 day.
I suspect it may increase from here (more volatility) as the 50 day rarely dips below 10.
Attachments
Just some thoughts for the coming week..
I expect a rebound next couple of days (day?) with a max pot at 1115-1117. Then visiting 1090 before next rally? XTC in rally mode. The Bradley chart only points at turn points - not directions.
I expect a rebound next couple of days (day?) with a max pot at 1115-1117. Then visiting 1090 before next rally? XTC in rally mode. The Bradley chart only points at turn points - not directions.
Attachments
Last edited: