bbmac
Veteren member
- Messages
- 3,584
- Likes
- 789
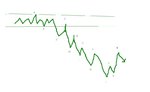
The attached diagram is a reperesntation of a typical trend.
This post concerns finding high probability low risk re-entries to the trend. Although I trade forex the methodology/technique is technical and can be used on any liquid instrument and any sensible combination of time frames
The methodology is as follows:
a. Designate 3 time frames as your 'longer time frame' your 'intermediatte time frame' and your 'trigger' time frame. Essentially you are looking to re-enter the trend that exists on your longer t/f by looking for set-ups on your intermediate t/f, with entry fine tuned on the trigger time frame.
The general method is as follows.
Once your longer t/f begins to trend by making a higher high or lower low for example or breaking out of a range (A and B represent the top and bottom of this example range) Look for price to retrace off a lower low on your intermediate time frame (in this down trend eg) and to make a lower high, finding resistance any where in the range/congestion. (this 'congestion 2nd b/o' is very often the true break out one, ie you often see a range/congestion break only to retrace back into the range or the bottom/top of the range before the true breakout occurs.)
In this example price indeeds finds resistance in the bottom half of the range consolidation at point C before selling down to a lower low at point D. Now if the trend is true the potential 'Resistance becomes Support' Zone is now the last retrace, so long as that retrace has been exceeded by a lower low (in this downtrend example) or indeed a higher high in an uptrend. Ie as price sells down to point D before retracing back, the RBS zone is now point X, the previous lower low to point C, the previous lower high, and so it goes on.
In terms of pinpointing entry I look for a combination of oscillator extremes/hidden divergence and band/channel deviation on the intermediate time frame with regular divergence or oscillator extremes onthe trigger and place the stop outside the last lower swing high on the intermediate time frame (in this downtrend example, points C,E,G,I ) or the last higher swing low in an uptrend example.
Staying with the downtrend example, when a retace of the last lower swing low [J] results in the last lower swing high being exceeded, then the trend on the inetrmediate time frame becomes questionable. In thisa example price retraces back off point J making a lower swing high at point K before making a higher swing low at L, so that at point M if you get a re-entry set-up which is still within the upper end of the last RBS zone, (points H to I) you would be wary that price made an equal lower swing high rather than an outright lower swing high, (ie lower than the last swing high at point I) and secondly price made a higher swing low at point L. If price had made a higher swing high at point M, than point I then I would hesitate further before re-entering the trend.
The methodology utilises the Alex Elder triple t/f approach with the phenomenon of Support becomes resistance (SBR) and resistance becomes support (RBS.)
I prefer the time frames of 1 5 and 30min as my trigger, intermediate and longer time frame, and utilising this methodology you will see today that in Gbpusd price consolidated in an asian range of 0108-0160 before an early european high at 0174, price then selling down out of the asian range bottom and making a lower low.
Following the 30min short trend the RBS areas on the way on the intermediate chart became 0079-0104, 0047-0075, 0022-0049, then a lower low at 0097 before a slightly higher high at 0052, price then consolidating between 0069 the daily low at the time and 0020, before the range/consolidation broke to the downside, price eventually finding support at the 9950 area, and although it made a lower high at the 2.0000 area in the last RBS zone of 9968-0013, it retraced down to make a higher low at 9964 before taking out the top of the last RBS zone ie the last lower swing hig at 0013 indicating that the trend on that time frame was probably over for now. ............Subsequently price has now retraced back to 0026bid at time of writing.
Of course in these situations you can move up your time frames in which case you would be looking for regular divergenec in both your old trigger and old intermediate and hidden divergence on your new intermediate time so long as the 'new' longer time frame was still trending and price was falling in the new intermediate's last RBS zone, in a downtrend example, as explained above.
Hope this is of some use to tech traders.