You are using an out of date browser. It may not display this or other websites correctly.
You should upgrade or use an alternative browser.
You should upgrade or use an alternative browser.
barjon
Legendary member
- Messages
- 10,752
- Likes
- 1,863
hi gixerman
don't know what you're looking at but can't see a pin bar myself.
have a look at this thread http://www.trade2win.com/boards/first-steps/26947-making-money-trading.html - it's a long read but trader dante explains pin bar set ups in detail.
cheers
jon
don't know what you're looking at but can't see a pin bar myself.
have a look at this thread http://www.trade2win.com/boards/first-steps/26947-making-money-trading.html - it's a long read but trader dante explains pin bar set ups in detail.
cheers
jon
From what I have read, a pinbar should only be used as a trigger to enter when some other preferred signal tells you that the price is overbought/sold. They do not have to be RS lines or Fib lines if you don't like them, but any reversal off an average, Bollinger Band etc.is given added credence if it is, also, a pinbar.
I agree with Jon, yours is not a pin on the daily.
I agree with Jon, yours is not a pin on the daily.
timsk
Legendary member
- Messages
- 8,903
- Likes
- 3,621
Hi gixerman,
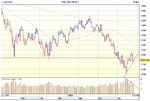
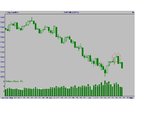
I agree with both Jon and Split' that there is NO pinbar set up in the S&P 500 - chart attached. A pin bar would indicate a potential long trade whereas, an inside bar formed on Friday, generating a potential short trade when the low of the inside bar and / or that of the previous bar (I call it a 'holding bar') is breached. Added to this, the support zone has been breached (pink line on the chart) and there is a divergence in volume and price. These provide a confluence of signals to suggest that the pullback from the mid July lows has run out of steam and there is likely to be a return to the downside next week. Suffice it to say, all the signs are bearish and none are bullish, IMO.
Tim.
Attachments
re pinbar
the chart iam seeing looks nothing like the one you posted it opens at 12583.0 a high of 1329.1 a low of 1249.2 and closed at 1253.4 a very small body i know but is still within range of left eye i have described it like this cos i am not sure i got the link to the image right as iam not used to posting thanks drew.Hi gixerman,
I agree with both Jon and Split' that there is NO pinbar set up in the S&P 500 - chart attached. A pin bar would indicate a potential long trade whereas, an inside bar formed on Friday, generating a potential short trade when the low of the inside bar and / or that of the previous bar (I call it a 'holding bar') is breached. Added to this, the support zone has been breached (pink line on the chart) and there is a divergence in volume and price. These provide a confluence of signals to suggest that the pullback from the mid July lows has run out of steam and there is likely to be a return to the downside next week. Suffice it to say, all the signs are bearish and none are bullish, IMO.
Tim.
re,pinbar
hi barjon
thanks for that but i have read trader dante thread last week with great interest and found it to be a very informative an exellent thread i hope i got the link right so you can see wot iam seeing if not here it is againhttp://cs2.it-finance.com-s&p rollingdaily hope you can see what i mean here ive sorted the link
http://cs2.it-finance.com/LCG/itcharts_lightplus.phtml?key=8539258747efb3e7b9f74f289bb77154&uid=119D40D185A81E620D94A8A76447A8A3
and if that dont work then iam f----- but its on capital spreads and it is massive pinbar i seen your chart and yes theres no pinbar but mine has thanks guys
start at post 74, page 8, if you're in a hurry - but all of it's worth reading!!
hi barjon
thanks for that but i have read trader dante thread last week with great interest and found it to be a very informative an exellent thread i hope i got the link right so you can see wot iam seeing if not here it is againhttp://cs2.it-finance.com-s&p rollingdaily hope you can see what i mean here ive sorted the link
http://cs2.it-finance.com/LCG/itcharts_lightplus.phtml?key=8539258747efb3e7b9f74f289bb77154&uid=119D40D185A81E620D94A8A76447A8A3
and if that dont work then iam f----- but its on capital spreads and it is massive pinbar i seen your chart and yes theres no pinbar but mine has thanks guys
Last edited:
re pinbar
take a look herehttp://cs2.it-finance.com-s&p rollingdaily on capitalspreads.com
is that a pin or am i seeing things thanks drew
hi splitlinkFrom what I have read, a pinbar should only be used as a trigger to enter when some other preferred signal tells you that the price is overbought/sold. They do not have to be RS lines or Fib lines if you don't like them, but any reversal off an average, Bollinger Band etc.is given added credence if it is, also, a pinbar.
I agree with Jon, yours is not a pin on the daily.
take a look herehttp://cs2.it-finance.com-s&p rollingdaily on capitalspreads.com
is that a pin or am i seeing things thanks drew
Last edited:
barjon
Legendary member
- Messages
- 10,752
- Likes
- 1,863
hi barjon
thanks for that but i have read trader dante thread last week with great interest and found it to be a very informative an exellent thread i hope i got the link right so you can see wot iam seeing if not here it is againhttp://cs2.it-finance.com-s&p rollingdaily hope you can see what i mean here ive sorted the link
http://cs2.it-finance.com/LCG/itcharts_lightplus.phtml?key=8539258747efb3e7b9f74f289bb77154&uid=119D40D185A81E620D94A8A76447A8A3
and if that dont work then iam f----- but its on capital spreads and it is massive pinbar i seen your chart and yes theres no pinbar but mine has thanks guys
mornin' gix
"access denied" to the link - but I think you're looking at the spread bet companies charts which reflect their quotes and not the real thing.
jon
morninmornin' gix
"access denied" to the link - but I think you're looking at the spread bet companies charts which reflect their quotes and not the real thing.
jon
yes your right it is and this is what i need to learn, the difference, but i cant help but notice that capital spreads are not that far of from the real price
timsk
Legendary member
- Messages
- 8,903
- Likes
- 3,621
Hi gixerman,
Attached is the eSignal chart of the S&P 500. Sorry to mix and match bar and candlestick charts. Nonetheless, as you can see, the two charts are very close and there's definitely no pinbar on Friday. I would be very wary of making trading decisions based on T.A. applied to charts that do not reflect the true price movement of the instrument being traded. This applies to charts provided by spread bet companies for the reasons Jon stated. Some members say that you can, sometimes, beat the spread bet companies at their own game - but you really have to know how they work and know when the 'edge' swings in your favour. Someone like trader_dante (among others) may well able to do this as he's an experienced and accomplished trader. I wouldn't have a clue I'm afraid, so I can't help you on that one!
Tim.
Attachments
re pinbar
so you are saying there is no such thing as a bearish pinbar if that is the case i think you had better read trader dantes thread also see what happened today to the s&p and it will go loweer to about 1100 maybe not quite that far thanks anyway GIX
Hi gixerman,
I agree with both Jon and Split' that there is NO pinbar set up in the S&P 500 - chart attached. A pin bar would indicate a potential long trade whereas, an inside bar formed on Friday, generating a potential short trade when the low of the inside bar and / or that of the previous bar (I call it a 'holding bar') is breached. Added to this, the support zone has been breached (pink line on the chart) and there is a divergence in volume and price. These provide a confluence of signals to suggest that the pullback from the mid July lows has run out of steam and there is likely to be a return to the downside next week. Suffice it to say, all the signs are bearish and none are bullish, IMO.
Tim.
so you are saying there is no such thing as a bearish pinbar if that is the case i think you had better read trader dantes thread also see what happened today to the s&p and it will go loweer to about 1100 maybe not quite that far thanks anyway GIX
barjon
Legendary member
- Messages
- 10,752
- Likes
- 1,863
er, I don't think tim was saying that there is no such thing as a bearish pinbar, gix, since he was only talking in the context of the bar you were questioning.
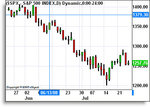
If you read Trader Dante's thread carefully you will see that a bearish pinbar occurs at the top of an up-trend (or minor trend) and not in the position you were looking at it. In the attached chart you will see no equivalent pinbar to the one you talked about. The circled bar is more like it, but would have needed to have had it's body in the range of the previous bar and have a longer upper tail to be seen as a bearish pinbar.
The s&p may have gone down today but it was not immediately preceded by any pinbar, either in reality or as you described your chart showing. 1100? Really? Where do you get that from?
good trading
jon
Attachments
timsk
Legendary member
- Messages
- 8,903
- Likes
- 3,621
Of course not gixerman! LOLso you are saying there is no such thing as a bearish pinbar if that is the case i think you had better read trader dantes thread also see what happened today to the s&p and it will go loweer to about 1100 maybe not quite that far thanks anyway GIX
Thank you for the tip, but I'm very aware of pin bars and t_d's excellent thread. If you re-read my last post, you'll see that yesterday's (Monday) move lower was par for the course but, as Jon has explained in his post, the move can not be attributed to a pin bar - not least because no pin bar formed on Friday.
Tim.
Of course not gixerman! LOL
Thank you for the tip, but I'm very aware of pin bars and t_d's excellent thread. If you re-read my last post, you'll see that yesterday's (Monday) move lower was par for the course but, as Jon has explained in his post, the move can not be attributed to a pin bar - not least because no pin bar formed on Friday.
Tim.
I wonder if, in fact, that fall was caused by Friday's bar being an inside bar. TD is, also, writing in a thread about that! 😀
Split
new_trader
Legendary member
- Messages
- 6,770
- Likes
- 1,656
I wonder if, in fact, that fall was caused by Friday's bar being an inside bar. TD is, also, writing in a thread about that! 😀
Split
Yes, that makes a lot of sense. I think I even heard an analyst on Bloomberg say, "The markets fell today due to an inside bar"
timsk
Legendary member
- Messages
- 8,903
- Likes
- 3,621
Hi Split,I wonder if, in fact, that fall was caused by Friday's bar being an inside bar. TD is, also, writing in a thread about that! 😀
See my post # 5, page 1.
😉
Tim.
timsk
Legendary member
- Messages
- 8,903
- Likes
- 3,621
I love to hear things like this, it makes me feel really good - a huge ego boost. If an analyst can come out with such obvious, total utter cr@p on Bloomberg no less, then there really is hope for mere mortals like me. No instrument falls or rises because of an inside bar; it's what the inside bar tells us about market sentiment that's important. When the inside bar is breached, the market sentiment has shifted its bias from temporarily neutral to down - in the case of the S&P yesterday. "The markets fell today due to an inside bar", I love it! Now, I wonder who I contact about getting a spot on Bloomberg . . .Yes, that makes a lot of sense. I think I even heard an analyst on Bloomberg say, "The markets fell today due to an inside bar"
Tim.
Similar threads
- Replies
- 1K
- Views
- 191K