Parallel channels are one of the most commonly seen patterns in charts. They give many opportunities to profit whether or not the market is trending. Horizontal channels are better known as trading ranges when the market is not trending; rising channels occur when market is trending up and falling channels appear when the market is trending down. Regardless of the market conditions seen, parallel channels can be found in all shapes and sizes.
Trade Recap
During the weeks in mid-June to early July, 2007, S&P 400 MidCap E-mini future has been moving up steadily inside a rising channel, as seen on the 60-minute chart below. Although the MidCap has been moving near the all time high, it has been trading in a large trading range. This parallel shows a smaller movement within that range.
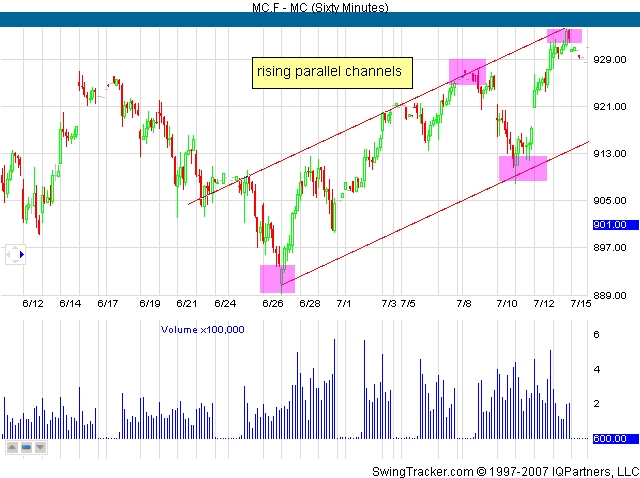
The parallel channels are identified when the two tops and two bottoms are identified (magenta boxes shown on chart above). Once this has been identified, the strategy is to wait for prices to approach the upper trendline or lower trendline to find a setup. There are two ways the prices can go: continue in the channel bouncing up and down the channel like a ping-pong ball or break above or below the channels; either prices accelerate the dominant trend or break and reverse in the opposite direction.
After the fifth contact was made, the market moved down to the lower trendline and pushed off from there.
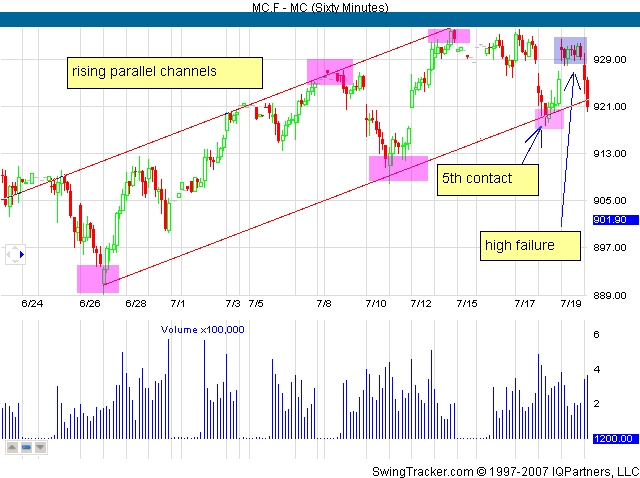
The push off the fifth contact didn’t last very long as it barely made it less than half way, when it turned down back to the lower trendline. When it finally made the touch to the lower trendline, it has been confirmed as a high failure. This means that the parallel channel was failing and the pattern was about to end. The market gives signs that either the market is about to consolidate or reverse. Although, this indicates a short is imminent, it is too early to take a trend until another confirmation is made: a lower high or a confirmation of the lower trendline to go from being a support to a resistance line.
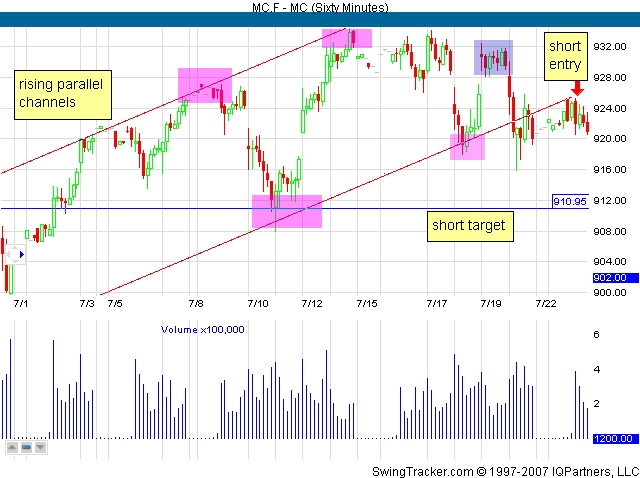
The short entry is made when the prices moved back to the lower trendline to use it as resistance. When it touched the trendline and reversed, breaking the previous bar’s low, it was a clear signal to short.
The stop is set at just above the trendline above the highest high of the bar (2 bars before the entry). This will ensure if the pattern was a fake-out then the short entry will assumed as premature or wrong. This profit target was chosen because it’s a very clear support level. The 2nd profit target is chosen as it is ideal as it sits at an even round number, 900. In addition it’s a clear support from the last reversal area.
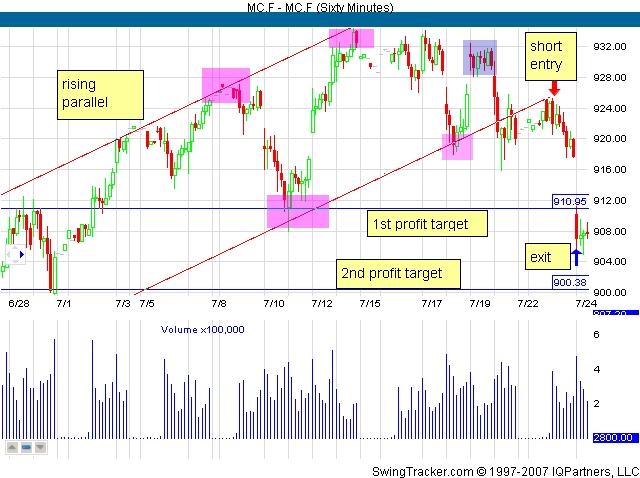
Almost immediately the first profit target is reached with a big gap down. Partial profits are taken immediately and a trailing stop for the last part of the position is moved to just above the bottom of the gap, 912. If this point if breached then the full position is liquidated. But prices hovered below this gap in the next few bars as seen above.
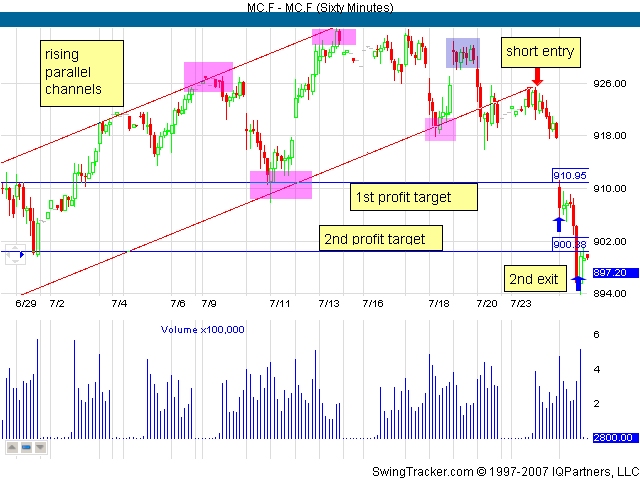
After the consolidation, the downtrend continued and reached the 2nd profit target to exit completely from the market.
Parallel channels are seen in almost all the timeframes and the entries and exits are clearly visible. This pattern provides a very good risk/reward ratio, making it an easy strategy to follow. The trick is to find them and watch for them to develop into a low-risk setup to take advantage of them.
Trade Recap
During the weeks in mid-June to early July, 2007, S&P 400 MidCap E-mini future has been moving up steadily inside a rising channel, as seen on the 60-minute chart below. Although the MidCap has been moving near the all time high, it has been trading in a large trading range. This parallel shows a smaller movement within that range.
The parallel channels are identified when the two tops and two bottoms are identified (magenta boxes shown on chart above). Once this has been identified, the strategy is to wait for prices to approach the upper trendline or lower trendline to find a setup. There are two ways the prices can go: continue in the channel bouncing up and down the channel like a ping-pong ball or break above or below the channels; either prices accelerate the dominant trend or break and reverse in the opposite direction.
After the fifth contact was made, the market moved down to the lower trendline and pushed off from there.
The push off the fifth contact didn’t last very long as it barely made it less than half way, when it turned down back to the lower trendline. When it finally made the touch to the lower trendline, it has been confirmed as a high failure. This means that the parallel channel was failing and the pattern was about to end. The market gives signs that either the market is about to consolidate or reverse. Although, this indicates a short is imminent, it is too early to take a trend until another confirmation is made: a lower high or a confirmation of the lower trendline to go from being a support to a resistance line.
The short entry is made when the prices moved back to the lower trendline to use it as resistance. When it touched the trendline and reversed, breaking the previous bar’s low, it was a clear signal to short.
The stop is set at just above the trendline above the highest high of the bar (2 bars before the entry). This will ensure if the pattern was a fake-out then the short entry will assumed as premature or wrong. This profit target was chosen because it’s a very clear support level. The 2nd profit target is chosen as it is ideal as it sits at an even round number, 900. In addition it’s a clear support from the last reversal area.
Almost immediately the first profit target is reached with a big gap down. Partial profits are taken immediately and a trailing stop for the last part of the position is moved to just above the bottom of the gap, 912. If this point if breached then the full position is liquidated. But prices hovered below this gap in the next few bars as seen above.
After the consolidation, the downtrend continued and reached the 2nd profit target to exit completely from the market.
Parallel channels are seen in almost all the timeframes and the entries and exits are clearly visible. This pattern provides a very good risk/reward ratio, making it an easy strategy to follow. The trick is to find them and watch for them to develop into a low-risk setup to take advantage of them.
Last edited by a moderator: