Beyond Price Action

I am done for the day

The important issues for retail traders are as follows

1) Select the time frame that works for you (15 min is recommended for retail)
2) Do your prep
a) Analysis of which setups worked best (and which failed) during the previous week
timing of entries is also part of the analysis. Once you document the times when
entries occur, you will start to see patterns, for example, in the S&P futures, it is common
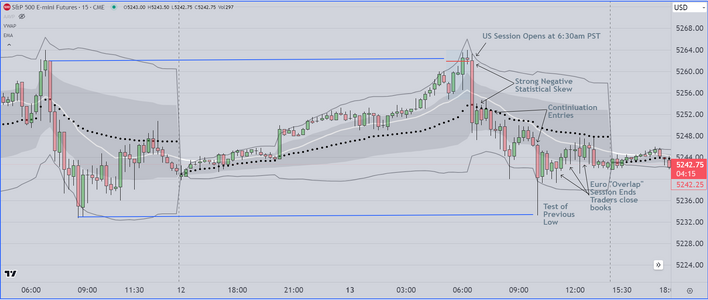
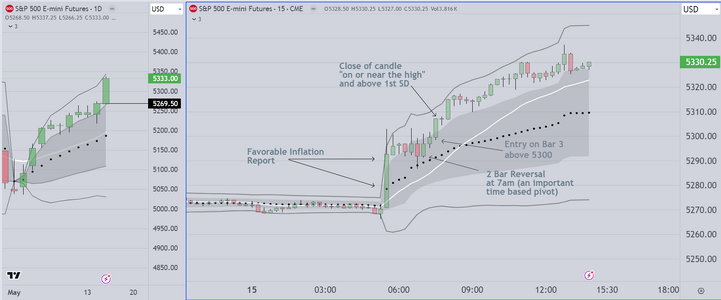
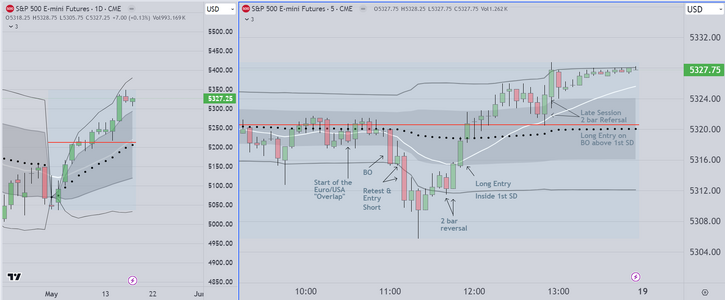
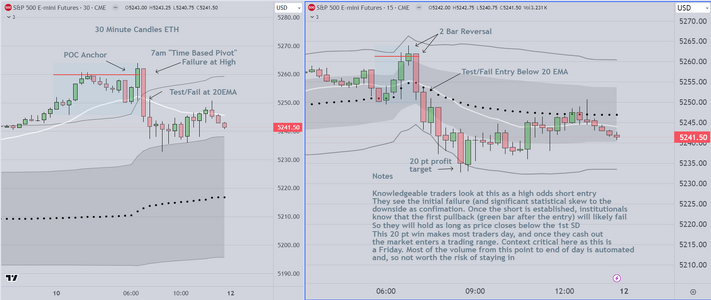
to see trends move originate at or near 7am (PST/US time)
b) Timing of (high impact) economic reports (most important reports occur at 5:30am PST/USA time)
c) Create trading plane to include both long and short scenarios
3) Review the previous sessions (ETH and RTH) prior to trading

Most of this is about discipline, and repetition is key to your success

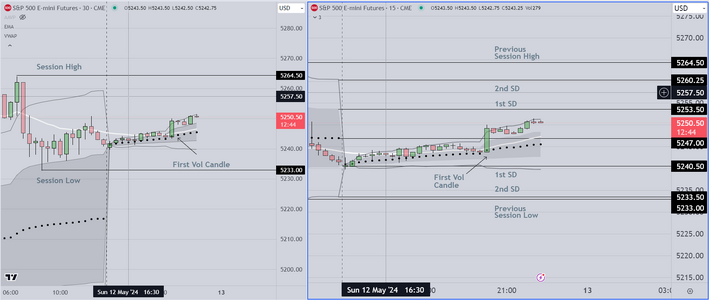
At the open, prompt recognition of "day type" is critical. Generally I can identify the
type of day (trend or trading range) within the first 15 minutes). After that I adjust
my trading plan and wait for the right entry

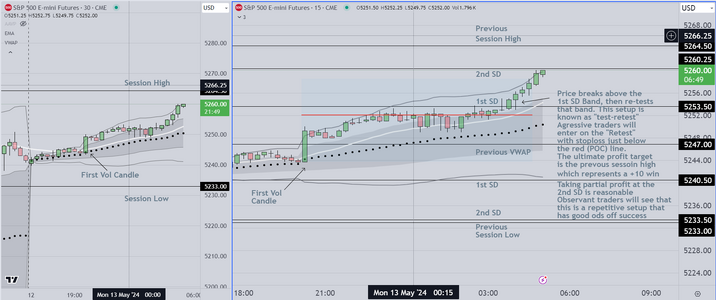
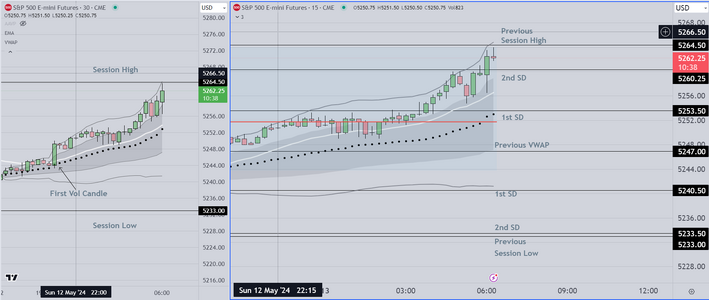
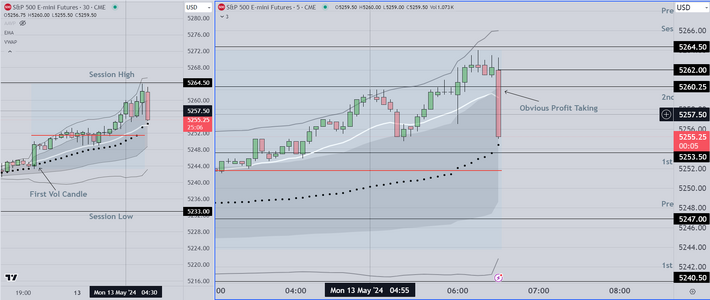
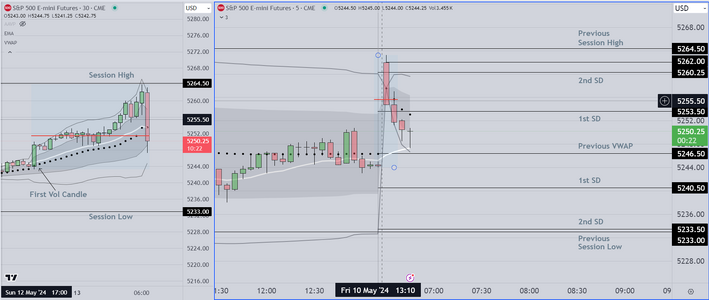
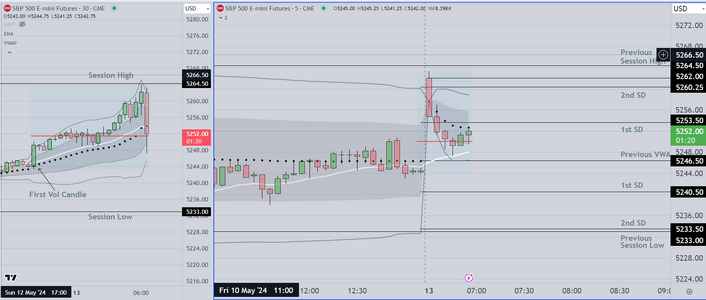
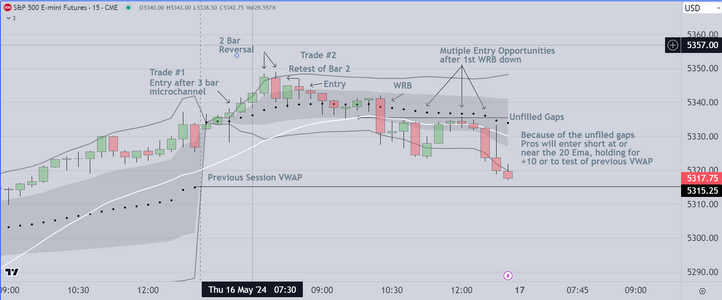
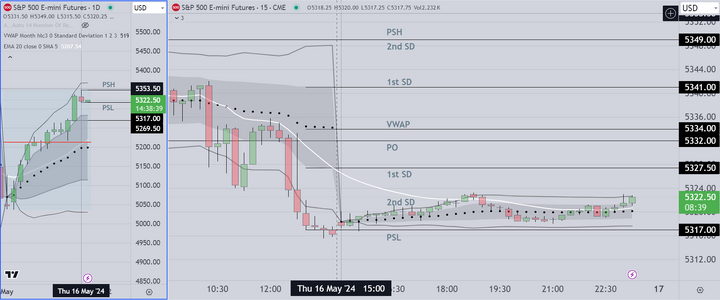
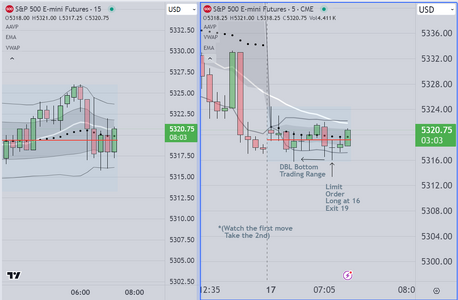
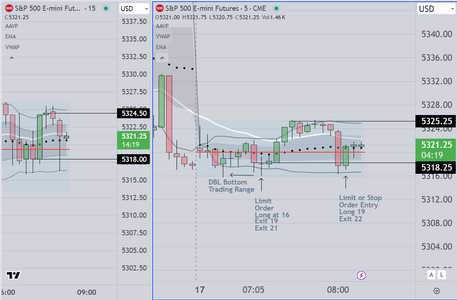
Attaching today's chart below
 

Attachments

  • Trend Day Example.PNG
    Trend Day Example.PNG
    119.3 KB · Views: 30
Last edited:
This chart is what I recommend for traders who may be struggling to find an edge
On the left, we display 30 minute candles and ETH (Globex) market.
On the right, 15 minute candles and again the ETH market
We anchor our VP/POC starting at the London Open.
We look for evidence of a specific type of setup called "Test/Fail", where institutions
signal their intent to either continue a previous trend move or (more likely) reverse
and take profit into the "Overlap" period, where Euro traders close books. This one
trade when structured properly, can make the day, especially if the trader is able to
recognize the opportunity early, and stay with a position. Experienced traders know
that price is likely to "continue" to trend as long as each close is below the 1st SD.

What I find most interesting is the emotional response of less experienced traders
who watch me do this day after day, and still have trouble staying in a trade long
enough to get to either the 10pt or 20pt profit targets, even after I explain that
these are common targets for both automated programs and skilled professionals.

Good luck this week
 

Attachments

  • Friday Trade Example.PNG
    Friday Trade Example.PNG
    165.3 KB · Views: 6
This chart shows (part of) the method I use to determine both initial volatility
and the point at which I will anchor the FRVP (Fixed Range Volatility Profile).
Anchoring the VP at the point of initial volatility allows for significant sample
size to accumulate in advance of London Open at Midnight PST/USA time.

For UK/EURO traders this is particularly important. Without the proper sample
size, the indicator (which I use to determine statistical skew) is less reliable, and
thus you lose your edge. It's attention to details like this that are the difference
between having a system that can be used to make a nice living, and one that is
essentially like flipping a coin (or worse).

By the way, observant readers may remember some few posts back, where I advise
struggling traders to learn basic probability & statistics. Here in the States, it takes
about 20 weeks (at a local Community College or University). As anticipated the first
reader to respond asked if I were serious. At the time, I responded that having made
a recommendation I had no further comment. The truth as I see it, is that retail traders
are at a disadvantage. The analogy I use here is to ask traders (who like American Baseball)
to go to what we call a "batting cage", and try to hit a fastball thrown at 95 mph, about the
same velocity as that of a Major League Pitcher. Generally it only takes one (1) such experience
for them to understand what it is really like to compete against professionals.
 

Attachments

  • First Volatility Candle ETH.PNG
    First Volatility Candle ETH.PNG
    127.7 KB · Views: 7
Last edited:
. . .By the way, observant readers may remember some few posts back, where I advise
struggling traders to learn basic probability & statistics. Here in the States, it takes
about 20 weeks (at a local Community College or University). As anticipated the first
reader to respond asked if I were serious
. At the time, I responded that having made
a recommendation I had no further comment. . .
Hi Steven,
If you're referring to me - I never asked if you were serious. It's obvious to one and all that you're very serious! What I actually said was: "I don't doubt that having a sound understanding of statistics is likely to be helpful to all traders. That said, I presume you don't expect beginners or experienced traders alike to take a minimum of one - and preferably two - 20 week classes in statistics simply in order to be able to understand your methodology?"
That's very different from questioning if you're serious and so, on this occasion, I'm afraid you anticipated incorrectly. Just sayin! ;)
Tim.
 
Last edited:
In my view, this should be obvious, but for the sake of others let me just state
the obvious.

Wherever professionals are competing it is unlikely that amateurs will prevail
This is especially true in the financial markets.

Rather than lose you own money, trade a simulated account, until you can prove
(to yourself) that you can make a consistent profit.
 
As seen in this chart, the prior session high profit target was obtained
just prior to the US open. Once again, close to +10 pts for traders
using aggressive entry and holding

Typically this next bar (prior to the open) will be a profit taking pullback
 

Attachments

  • Previous Session High Reached.PNG
    Previous Session High Reached.PNG
    126.3 KB · Views: 7
And this chart shows the transition, shortly after the US open
from ETH (Globex) to RTH and from 15 min to 5 min Candles

This is the framework that I use. As was previously mentioned
I recommend that retail traders stay with the 15 min time frame
as it will keep them out of trouble, preventing them from sustaining
early losses

Notice that this allows me to take a short entry (below the red POC)
 

Attachments

  • Opening Swith from ETH to RTH.PNG
    Opening Swith from ETH to RTH.PNG
    129.5 KB · Views: 8
This will be my final post today

As can be seen in the chart attached. The POC/VWAP
relationship has changed such that we now have a
developing long bias (and 2 bar reversal in progress)

So far this morning we have a successful short entry
followed by a potential reversal and long entry above
the dots (as we transition to the current session VWAP)

Good luck everyone
 

Attachments

  • 2nd Entry Example.PNG
    2nd Entry Example.PNG
    133.5 KB · Views: 9
Getting to sleep early this evening so I will post this "End of Session"
chart.

I want to point out the following

1) It helps to use ETH charts. As seen in the attached example, it is often the case
that we can extend lines from the previous to the current session, and when combined
with knowledge of the statistical skew, you have a significant edge right from the open

2) After the opening short entry, we thought price might reverse. It did not. Instead price
created several continuation entries. The continuation entries were created after price tested
one of two (2) "Key References" (the VWAP and the 20 period EMA).

3) There's no proprietary "magic" indicator here, and like every skilled trader, we use the basic
tools to frame the market, and then we adjust to what we see. This is about solving a problem
within a constrained time period. You watch the market unfold. You make note of how the market
reacts to tests of specific points of reference and you wait for specific setups so that you can enter
with the odds in your favor.

Due to previous obligations, there will be no posts tomorrow
 

Attachments

  • End of Day Chart 5-13-2024.PNG
    End of Day Chart 5-13-2024.PNG
    145.9 KB · Views: 8
Last edited:
Integrating trades with economic reports is part of the training
that a skilled person should obtain in order to create a sustainable
business model

We create a "look ahead" schedule of high impact reports at the
beginning of each month. We create scenarios (long & short) based
on the best available consensus, modifying as we move through time.

Today the inflation report came out favorable, and the market response
was obvious. Using 15 minute candles we saw a wide range bar initially
and that bar closed above the midpoint, suggesting that we could expect
a pullback and 2nd leg up. One of the things we ask clients to do is to go
back at least two (2) report cycles to look at how the market has responded
in terms of initial move, follow through, and duration of effect.
After traders have done this a couple of times, they see that it creates
confidence, because it allows them to 1) structure trades accurately, 2) hold
winners longer 3) while reducing stress

By the way, its amazing how many clients argue that this is unnecessary
even though they are net losers, AND are competing with professionals
who are more than willing to make this commitment in order to gain an
edge over the competition

Finally please note, when you have a "post report" candle closing "on or near
the high" and above the 1st SD, it is a strong signal that this is a trending market
and skilled traders will either add to positions or at the very least, will NOT sell
as long as each bar closes above the 1st SD band


Today was an excellent example of what (some) professionals call a "layup"
(a trade with very high odds of success).
 

Attachments

  • Inflation Report Example.PNG
    Inflation Report Example.PNG
    148.8 KB · Views: 7
Last edited:
While waiting for economic reports to be released (in 15 min), I thought
I would post this weekly chart

Longer time frame traders use this to trade options
The pattern is simple. After a significant trend move
price breaks down, below two important (2) "Key References"
When I say important, I mean that these are followed
closely by institutional and commercial traders who have
the ability to mobilize significant money (when they see
a reasonable opportunity. More specifically, if the pattern
and context suggest high odds of success, they build a
position and stay with it, to its reasonable conclusion,
which in this case is a retest of previous high, more than
200 pts above the entry

The pattern is one that we see often enough to teach
as follows

1) Context is a significant trend, followed by a reversal
to test one or more key references
2) Failure of the breakup or down (reversal at or near
the key reference)
3) Retest of Bar 2 extreme, followed by buyers or sellers
returning to defend the original trend

Entry can be at any point after the open of bar 3
with the first target contingent on the operator's
internal objectives. Most commercial traders will use
options (spreads, put sales, outrights, etc) while trading around
a base position. In this instance the result would have
been significant with +100 and +200 pts when positions
are held
 

Attachments

  • Weekly Chart Analysis.PNG
    Weekly Chart Analysis.PNG
    66.6 KB · Views: 7
Today's Chart Markup

This was an easy and obvious chart to trade (for me) however
several struggling traders watch me work, expressed frustration
at the difficulty they had anticipating reasonable entry. We attribute
this to lack of experience, and suggest to all new or struggling traders
that they only trade sim, not real money.

We marked up a 15 min chart because it keeps struggling traders from
entering too soon (and spending the rest of the session trying to overcome
early losers). On that chart, you will notice that the first two (2) bars are trending
and the third bar is an attempted reversal that fails, as buyers enter. Based
on that data, traders would reasonably enter long on the open of the fourth
bar, with stop loss below the bar and profit target of +10 pts.

As regards the lack of experience, please note later on the chart, where we state
that there are multiple "unfilled gaps". The general rule of thumb (for professionals)
is that once you see two (2) unfilled gaps, you then look for a reasonable entry
that you can take for swing (+10 profit target). Profit targets are always +10
and/or a reasonable profit target higher or lower (we suggest the previous VWAP
at or near +15). Without the requisite experience, or without seeing someone
do this in real time (and explain it to you) it might take years to figure this out
Awareness of unfilled gaps (there are several types) is a critical aspect of successful
trading, because it shows you where traders are "trapped", AND increases the odds
that your entry will be successful.
 

Attachments

  • Trade Example Unfilled Gaps.PNG
    Trade Example Unfilled Gaps.PNG
    134.2 KB · Views: 10
Here is an example of the chart market we recommend for
retail traders. The display shows two (2) charts, on the left
we have daily candles framed by a monthly VWAP. You will
also see a red line at the middle of that chart. Currently it is
showing what we call a "Symmetric" market, meaning that
there is no statistical preference (chances about equal for
price to move up or down. As the ETH market develops this
evening it is normal for that red line to change position, thus
indicating a statistical preference (called "Skew"). Skilled traders
with a background in basic statistics can use that data to find
entry (both long & short) that have good odds of success.
 

Attachments

  • Evening Markup Retail Traders.PNG
    Evening Markup Retail Traders.PNG
    154.5 KB · Views: 9
For this post we suggest readers refer first to the previous post, where we display our
recommended setup for beginning or struggling traders. On the left we show a daily
chart and the red line is the VP/POC. The important thing to notice is that the red line
(POC) terminates right next to the black dot (representing the VWAP). This relationship
is predictive and shows the market to have a "symmetrical" skew. As we mentioned during
the first several posts, knowledge of basic statistics is important. Those who have that
basis, would quickly understand that this means, that the market will likely not be trending
in the next session. Why? because the institutions that control THIS market have offset each
other (in terms of putting money to work on the long and short side). Its a "standoff" and
for the present, there is no statistical preference (up or down), until one side overcomes the other.

Jump ahead to the present session charts and look at what you see. At the open, price movement
creates what we know to be a "trading range" market. The range is constrained, the bars overlap
with prominent tails. Although the range expands as time goes on, this is what we get until the
end of the session

We suggest traders who are struggling do NOT trade in this environment. If they do, odds favor
losing, because

1) The only way to profitably trade is to use limit orders. If a trader tries to trade this using stop
or market orders they will get bad fills and they will likely NOT get filled at the exit price they are
looking for
2) They (generally) do not know how to frame the market in order to see the entry points. We have
talked (briefly) about how this can be done by marking the chart, to show the highest and lowest
closes (and adjusting those "frames" as the session wears on.
3) Finally, inexperienced traders tend to enter early in trading range markets, incurring early losses
that put them in the red. Then they have to spend the rest of the session trying to get back to even.
The usual result is that they make poor decisions and things go downhill from there.
4) We suggest instead of trading this type of market, traders monitor patiently, waiting until they see
a WRB (wide range bar) breaking out of the range. That usually happens late in the session (if at all)

This first chart below shows how I trade, and again I don't suggest this for retail traders. I know what to
expect BEFORE the market opens, how to frame the action, and how to position myself using limit orders

Here is the first hour
 

Attachments

  • Limit Order Example Friday 5-17.PNG
    Limit Order Example Friday 5-17.PNG
    109 KB · Views: 3
And here is a chart showing more of the same
with markups showing reasonable entries and
exits

Notice the horizontal lines marking the high and low
closes, then later, when price retests, we have points of
entry already setup for us.

Using this system, we have enough time to recognize when
the entry price will be reached, so we can place our limit orders
and get filled promptly. We also know (and expect) that we may
be scaling in, if price moves past our initial entry. This is known
as "best practice" and the reason it works is that in a trading
range, even if price moves past initial entry, it is NOT going far.

The general principle is that trading ranges are very forgiving
IF you know the larger context (how the institutions create,
and trade them).
 

Attachments

  • Limit Order Example 2.PNG
    Limit Order Example 2.PNG
    108.7 KB · Views: 4
Last edited:
Here is my last chart showing the Euro/USA "Overlap" (what I call a "time based pivot")
As I have mentioned previously, this is a time when Euro based institutions and other
commercials are closing books. I show my chart using 5 min candles. When training others
I run both 15 min and 5 min charts side by side, so that students can see the tradeoffs
between the setups. In this instance, I find the 5 minute easier to trade because it provides
the information necessary to make additional trades at the end of (US) session.

What we illustrate is what a struggling or student trader would look for. A WRB (Wide Range Bar)
breaking out of the trading range to the downside, followed by a retest of Key Reference (in this case
the 20 Ema. Hopefully traders can see that the retest reverses right at the 20 EMA (what a coincidence)
knowledgeable traders will enter promptly when they see this as odds greatly favor this short entry.

The subsequent reversal to the upside, is also easy to see, as it is "framed" by the VWAP, with price creating successive
2 bar reversals all the way to the end of session, as automated programs act to reposition inventory
for the next week
 

Attachments

  • Euro USA Overlap Example.PNG
    Euro USA Overlap Example.PNG
    138.2 KB · Views: 4
With this next post I am going to take a different direction.

I am going to ask readers

What are the three (3) issues about trading that you find most frustrating?
 
Top